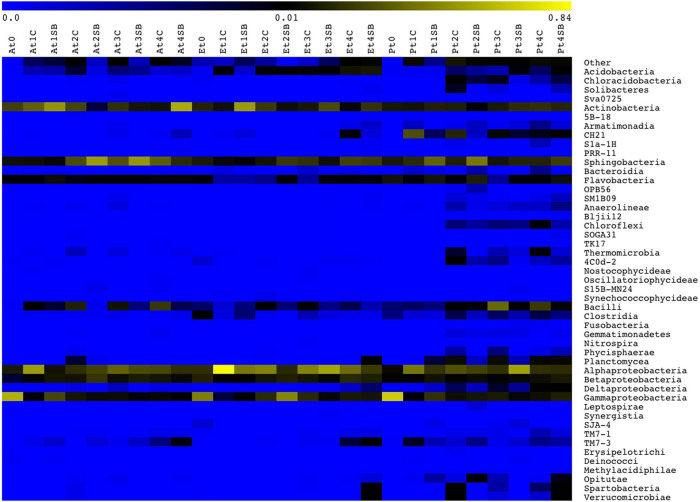
Figure 2. Distribution of bacterial classes in lignocellulosic biomasses during the biodegradation process.
Colour scale indicates the relative abundance of each OTU within the samples. Abbreviations. A: A. donax; E: E. camaldulensis; P: P. nigra; T0: 0 days of degradation; t1: 45 days of degradation; t2: 90 days of degradation; t3: 135 days of degradation; t4: 180 days of degradation; OF: open field degradation condition; UW: underwood degradation condition.

