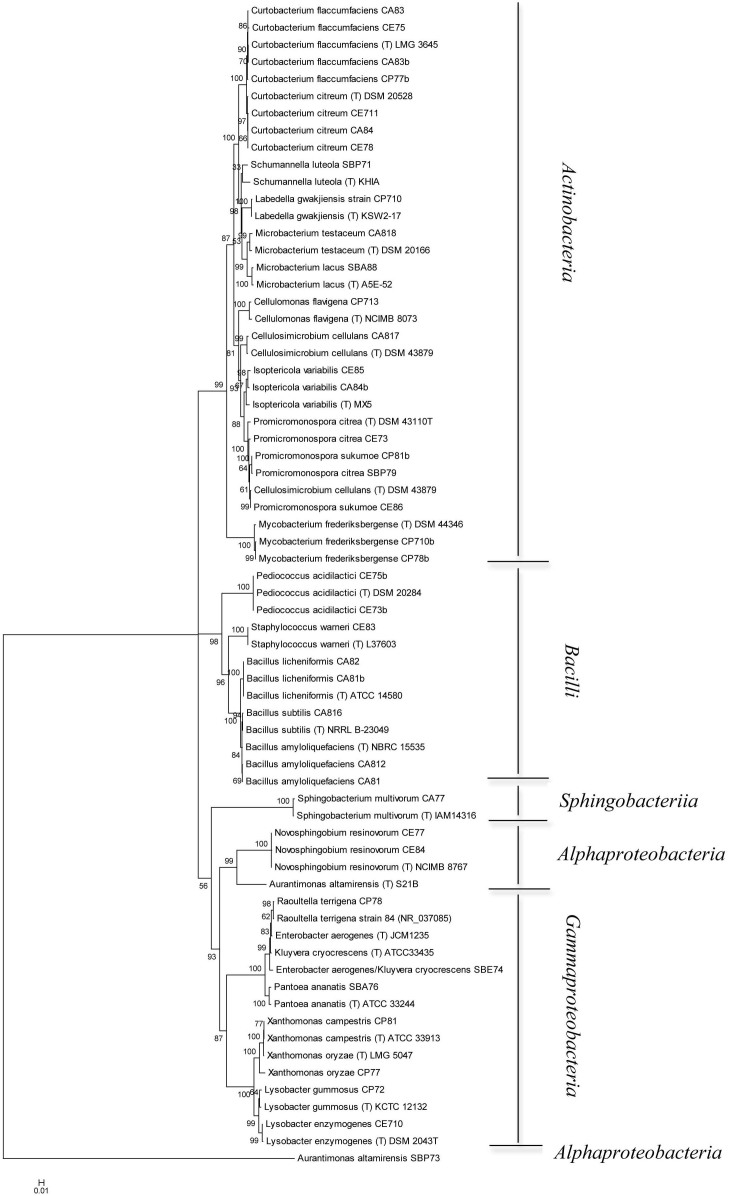
Figure 5. Neighbour-Joining tree based on the comparison of 16S rRNA gene sequences showing the relationships among cellulolytic strains.
Bootstrap values (expressed as percentages of 1,000 replications) greater than 50% are given at the nodes. Strains marked with “(T)” represent type strains. The scale bar estimates the number of substitutions per site.

