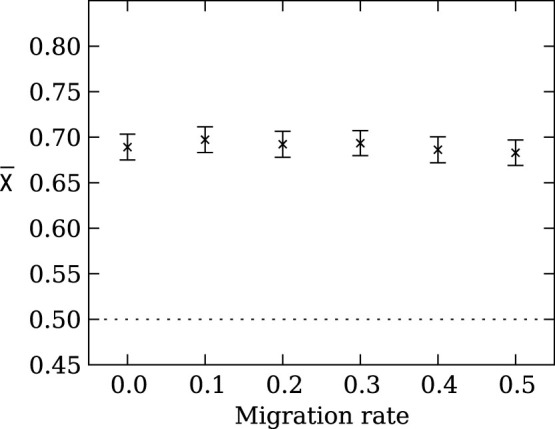
Figure 4. Mean strategy  on the line of descent at generation 950 as a function of the migration rate in an island model genetic algorithm with 128 groups with 128 members in each group.

Regardless of the migration rate, it is the group size and not the total population size that determines if the agents evolve risk sensitive strategies. Error bars indicate two standard errors over 1,000 replicates. The dotted line indicates the expected value for unbiased choice, i.e., no strategy preference. A migration rate of 0.5 implies that half of the agents in each group migrate every generation.
