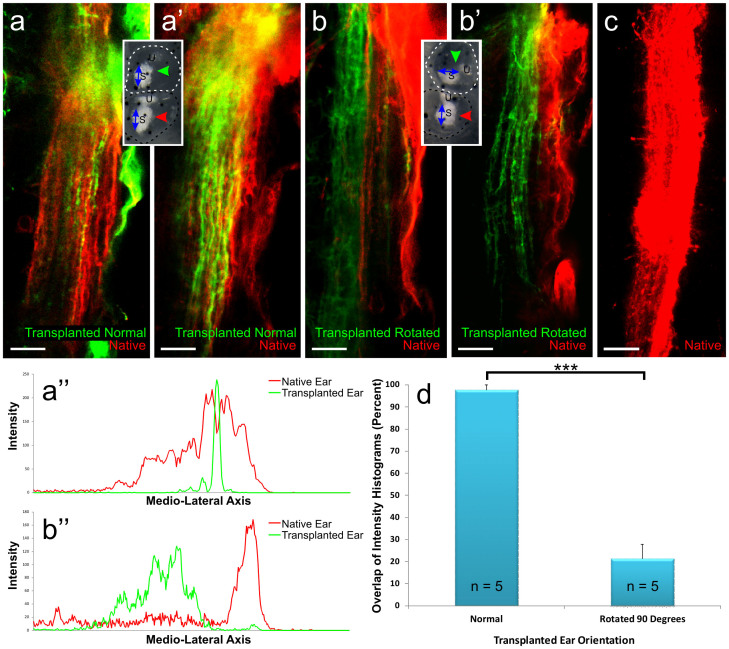
Figure 4. Overlap and segregation of inner ear afferents from transplanted and native ears.
(a-a’) Hindbrain from two animals in which the transplanted ear was in the native orientation showing overlap of sensory neurons from the native (red) and transplanted (green) ears. (b-b’) Hindbrain from two animals in which the transplanted ear was rotated by 90 degrees with respect to the native ear showing segregation of sensory neurons from the native (red) and transplanted (green) ears. Insets indicate the transplanted ear orientation. Red and green arrows indicate lipophilic dye placement. (a”) Intensity histogram from an animal with the transplanted ear (green) in line with the native ear (red) shows an overlap of intensity profiles in a single optical section. (b”) Intensity histogram from an animal with the transplanted ear (green) rotated by 90 degrees with respect to the native ear (red) shows a segregation of intensity profiles in a single optical section. (c) Hindbrain showing the native projection when only the control ear was on one side (red). (d) Mean percent overlap and standard error of sensory neurons from the native and transplanted ears for animals in which the transplanted ear was in line with or rotated by 90 degrees with respect to the native ear. 5 animals were analyzed for each condition. Each animal is the mean of measurements taken from 3 different optical sections. Error bars reflect the standard error of the means. ***, p<0.001. Scale bar is 25 µm.

