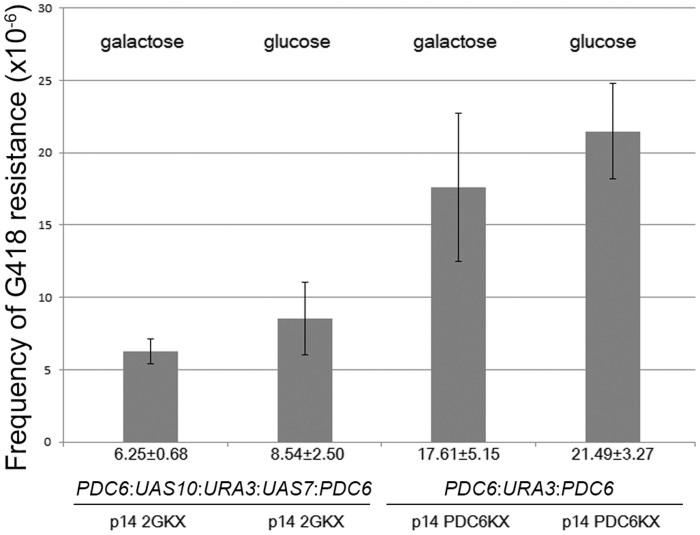
Figure 3. Effects of carbon source on AMT efficiency using yeast strain RSY12.
Bar one and two represent RSY12 with the pID2GU target locus (PDC6:UAS10:URA3:UAS7:PDC6) cocultivated with LBA1100 harboring p14-2GKX. Bar three and four represent yeast cells with the pIDU target locus (PDC6:URA3:PDC6), lacking the UAS promoter sequences, cocultivated with LBA1100 harboring p14-PDC6KX (pSDM14:rightborder:PDC6:KanMX:PDC6:leftborder). Every bar represents the average of 10 independent experiments (n = 10). The transformation efficiency as is shown at the Y-axes should be read as ‘per million’ as is indicated with (×10−6). Error bars indicate the SEM. The hypothesis of equality could not be rejected with α set to 0.05 when performing a two-tailed heteroscedastic Student's T-test comparing “galactose” with “glucose”.

