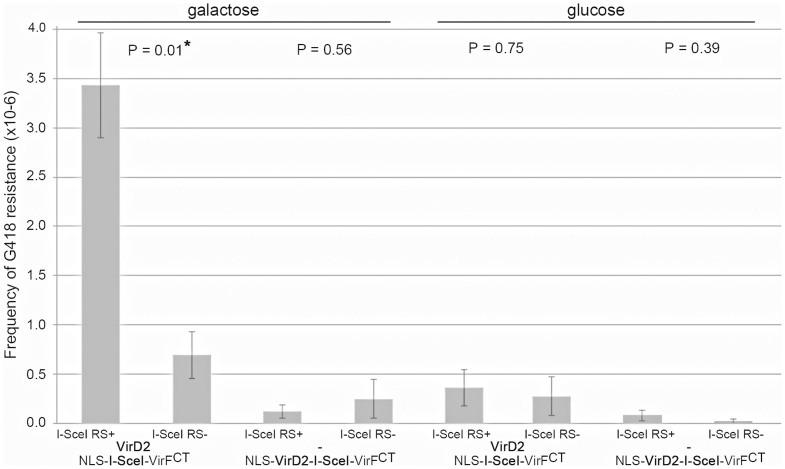
Figure 4. Influence of galactose or glucose treatment on the I-SceI assisted integration of T-DNA by HR.
The yeast strain RSY12 was cocultivated with LBA1100 harboring p14-2GKX (pSDM14:rightborder:UAS7: KanMX:UAS10:leftborder) and pBFF I-SceI or LBA2556 p14-2GKX and pBFF VirD2-I-SceI. Different yeast strains with and without I SceI recognition sites between the uracil autotrophy marker and the UAS promoter sequences making up the target locus (Figure 2A, 2C) were compared, here indicated as I-Sce RS+ and I-SceI RS−. A horizontal line is used to mark the presence of galactose (inducing nucleosome removal UAS regions at the target locus) or glucose (inducing nucleosome formation). Every bar represents that average of four independent experiments (n = 4). The p-values were calculated performing a two-tailed heteroscedastic Student's T-test. Error bars indicate the SEM. The asterisk indicates statistical significance with α = 0.05. The transformation frequencies were calculated by dividing the total number of G418 resistant colonies by an estimate of the total number of yeast cells.

