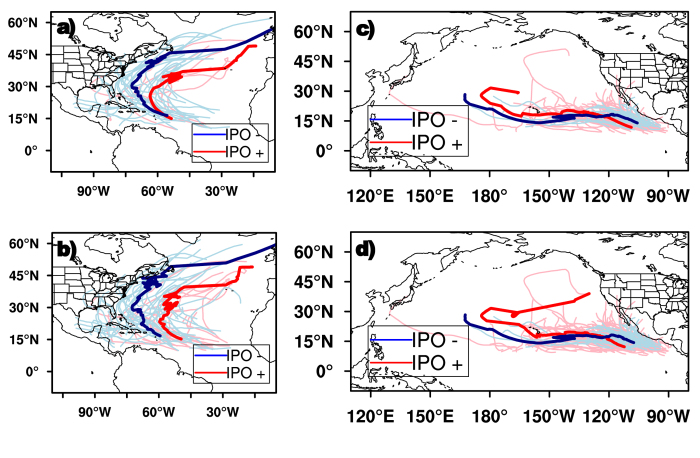
Figure 1. IPO impacts on TC and hurricane Tracks.
Track composite of hurricane and all TCs (tropical storms and hurricanes), respectively, during IPO positive (red) and negative (blue) phases over the North Atlantic (a,b) and eastern North Pacific (c,d). The maps in Fig. 1 were generated using NCAR Command Language (NCL) version 6.3.0, open source software free to public, by UCAR/NCAR/CISL/TDD, http://dx.doi.org/10.5065/D6WD3XH5.

