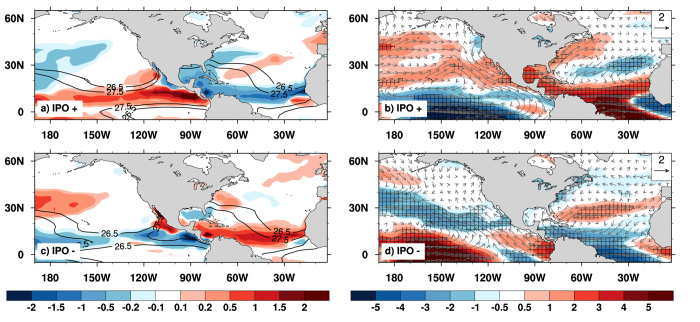
Figure 2. IPO influence on large-scale environmental factors for TC and Hurricane frequency.
(a,b) GPI (shaded) and SST (contour, unit: oC); (c,d) magnitude of wind shear anomalies (shaded) and the shear anomalies (vector, unit: m s−1) during the IPO positive (top) and negative (bottom) phases. Stippling indicates regions exceeding 90% statistical confidence. Figure 2 is generated using NCAR Command Language (NCL) version 6.3.0, open source software free to public, by UCAR/NCAR/CISL/TDD, http://dx.doi.org/10.5065/D6WD3XH5.

