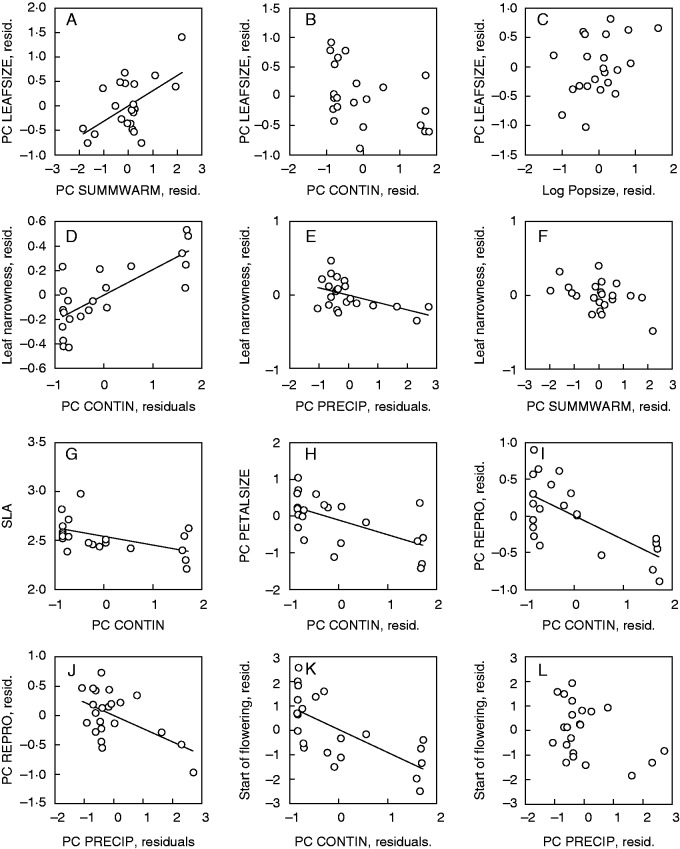
Fig. 2.
Relationships between (A–C) PC LEAFSIZE, (D–F) leaf narrowness, (G) SLA, (H) PC PETALSIZE, (I, J) PC REPRO, (K, L) start of flowering of Saxifraga sponhemica and significant explanatory variables. Shown are regression plots (G, H) in the case of single explanatory variables and partial regression plots (A–F, I–L) in the case of several explanatory variables. For statistical analysis see Table 4.

