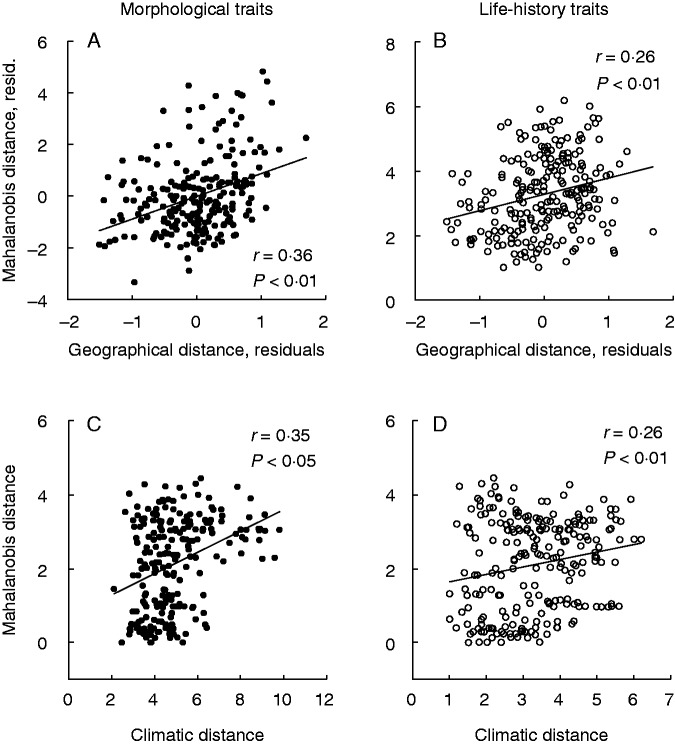
Fig. 5.
Relationships of pairwise quantitative–genetic distances between populations of S. sponhemica based on (A, C) morphological traits (filled symbols) and (B, D) life-history traits (open symbols) and (A, B) pairwise geographical distances and (C, D) pairwise climatic distances. In (A) and (B), partial regression plots are presented, in which the effects of geographical distance are adjusted for those of molecular genetic distance (pairwise FST).

