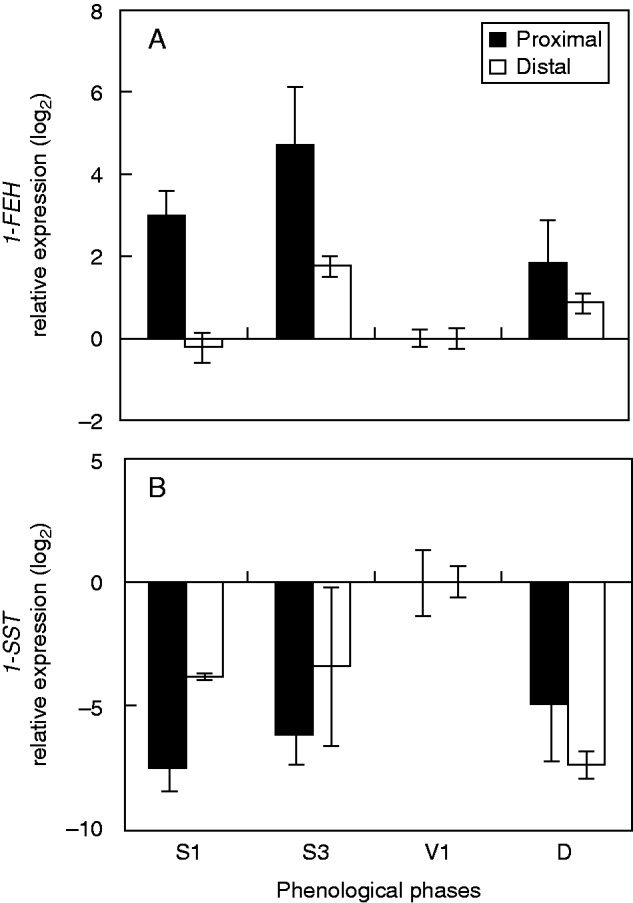
Fig. 7.

Relative expression levels (log2) of 1-FEH (A) and 1-SST (B) as assessed by qRT-PCR analysis in the proximal and distal rhizophore segments (see key) of plants of Chrysolaena obovata at different phenological phases (compared with the vegetative phase). Values are means (±s.e.) of two biological replicates with three technical replicates.
