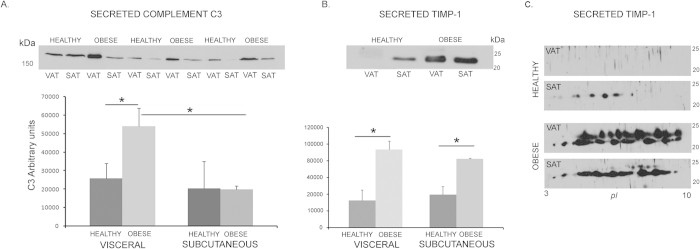
Figure 4. Validation of selected proteins.
Independent obese and healthy secretome samples from VAT and SAT depots were assayed by immunoblotting. C3 protein detection cropped image and histogram graph from band quantification is shown (A); TIMP-1 representative cropped image of 1-DE immunodetection of healthy and obese VAT and SAT secretomes (B); and 2-DE representative cropped western blots showing post-translational variants secreted by VAT and SAT from healthy and obese individuals (C). VAT: visceral adipose tissue; SAT: subcutaneous adipose tissue. Statistical significance is represented as *p < 0.05.

