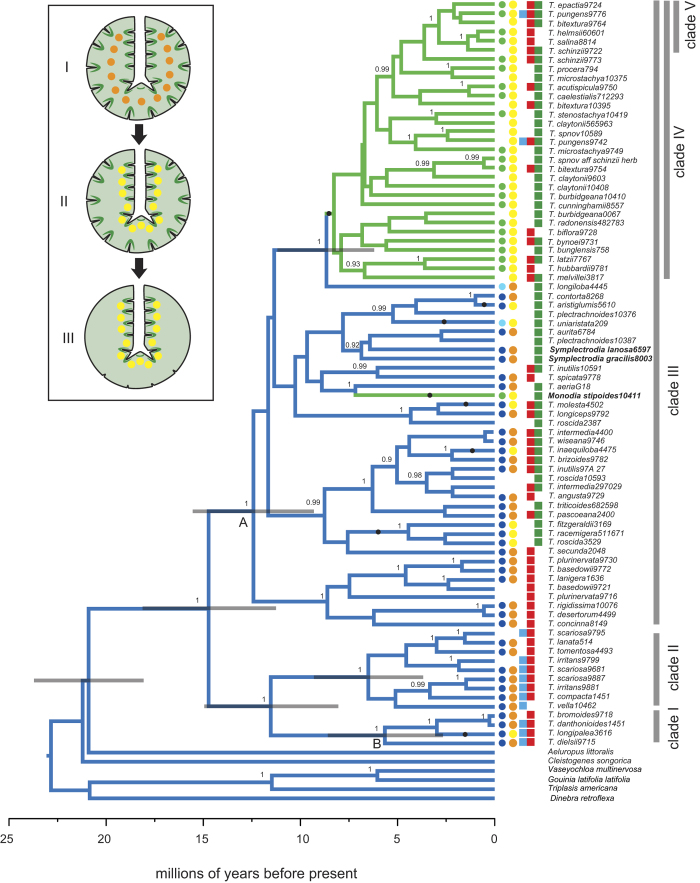
Figure 2. Timing and evolution of leaf traits of Triodiinae.
Chronogram of concatenated ITS and matK datasets showing the node ages and relationships within Triodiinae inferred using BEAST with a Random Local Clocks (RLC) model. Only a single terminal is shown for species in which individuals form a supported monophyletic clade. Posterior probabilities ≥ 0.90 are shown on nodes. Node bars indicate 95% highest posterior density of age estimates. Branches are colour-coded by the character reconstruction of the position of leaf stomata: epistomatous (green) and amphistomatous (blue). Inferred transitions of central to near adaxial vascular bundles are shown as closed circles on branches. Earliest biome transitions from Eremaean to savannah (Node A) and Eremaean to temperate (Node B) are shown. Leaf traits and biome of each species are shown to the right of terminals. The first column shows position of leaf stomata: epistomatous (green), amphistomatous (blue) and semi-amphistomatous (pale blue). The second column shows vascular bundle position: central (orange) and near adaxial (yellow). The third to fifth columns shows occurrence in a biome: temperate (blue), Eremaean (red) and green (savannah). Inset illustrates the hypothesised transition of leaf traits in Triodiinae: (I) ancestral state of amphistomatous with central vascular bundles. (II) move of vascular bundles to near adaxial position. (III) loss of abaxial stomata (epistomatous) in two lineages.

