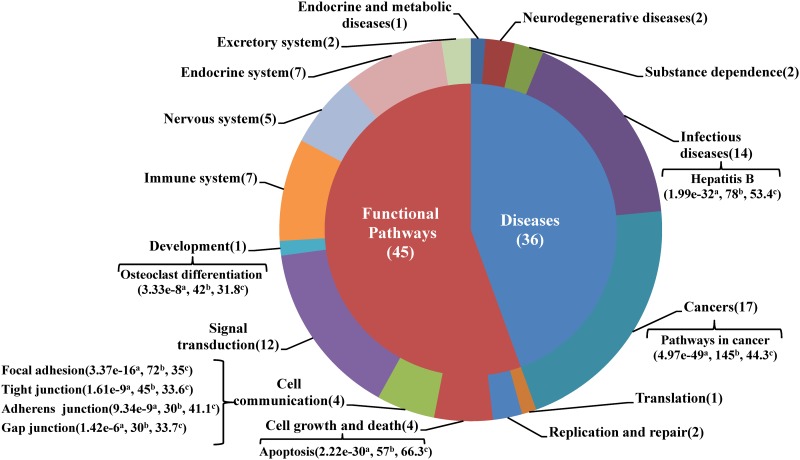
Fig 4. Subclasses of enriched KEGG pathways.
The number of pathways belong to each subclass is shown in parentheses. Pathways mentioned in section 3.2 are labeled. a: Benjamini and Hochberg adjusted p-value; b and c: Number and percentage of associated genes in each pathway. Percentage represents the proportion of associated genes in all known genes involved in a pathway.

