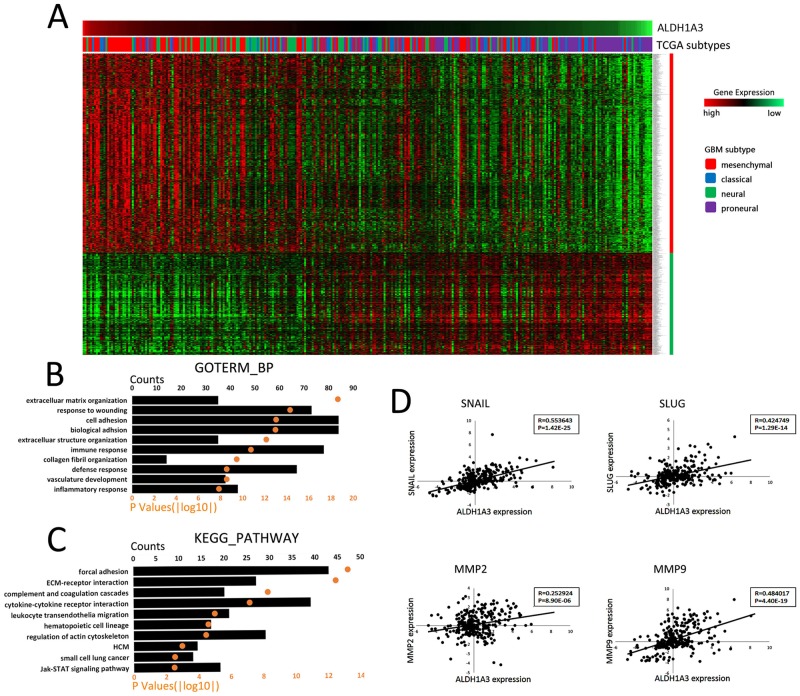
Fig 4. ALDH1A3 associated genes and their potential functions.
A. 301 patients are arranged according to descending order of ALDH1A3 mRNA expression. Mes sutype patients are mainly distributed in the side of ALDH1A3 high expression. Most of the patients with ALDH1A3 relatively low expression are PN suptype. By pearson correlation analysis, 869 and 472 unique genes (1125 and 579 probes) having positive or negative relationship with ALDH1A3 mRNA expression were obtained respectively. B, C. GO and KEGG pathway analysis of the positively correlated genes of ALDH1A3. The upper X-axis indicates gene counts (column chart); the lower X-axis indicates p-values (scatter diagram). The top 10 potential functions and pathways have been listed in the Y-axis. D. ALDH1A3 has positive correlation with tumor invasion related genes, including snail, slug, MMP2 and MMP9.

