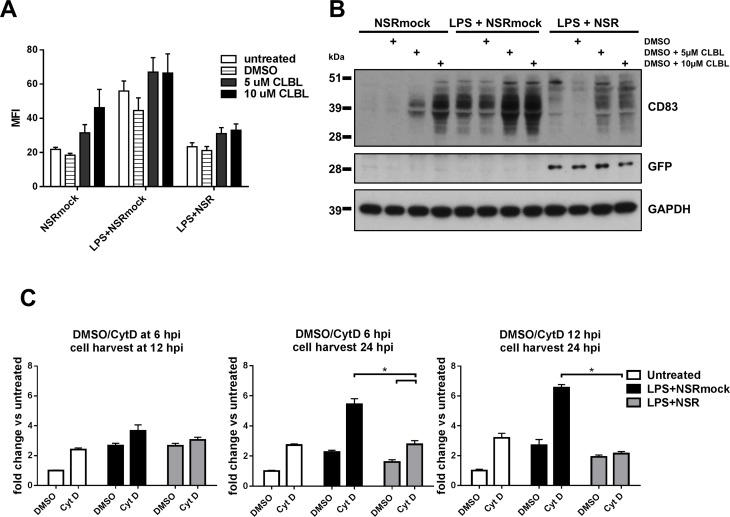
Fig 8. Expression of CD83 after inhibition of cellular protein degradation routes.
(A) Flow cytometry analysis of CD83 surface expression after inhibition of the proteasome. DCs were stimulated with NSRmock, LPS+NSRmock or LPS+NSR for 8 h and then clasto Lactacystin β-lactone (CLBL) was added at two concentrations, as indicated. Control cells were left untreated or were treated with DMSO. Cells were analysed at 24 hpi for CD83 expression. Bars represent average MFI ±SD from two experiments with cells from one donor (B) Detection of total amounts of CD83 in cell lysates by Western blot. Cells were stimulated as described under point “A” and treatments are indicated above the image. (C) Inhibition of endocytosis. DCs were stimulated with LPS+NSRmock, LPS+NSR or left unstimulated. Cytochalasin D (Cyt D) or the solvent DMSO were subsequently added at different time points. The moments of adding Cyt D/DMSO and harvesting of cells are indicated above each graph. Bars represent average fold change of the MFI relative to unstimulated cells treated with DMSO ±SD. Average values of three experiments with cells from one donor are depicted. Relevant statistical significances are shown.

