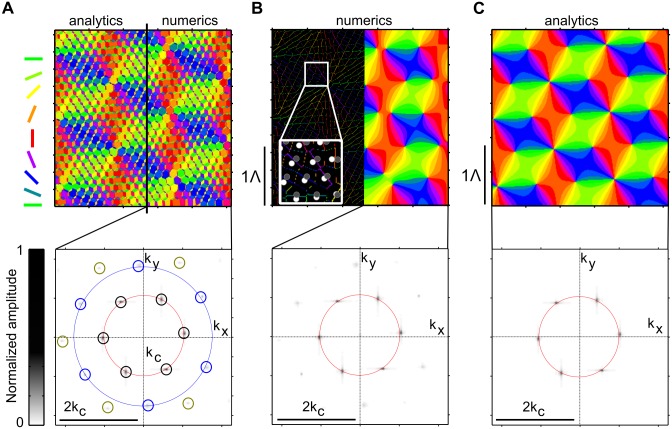
Fig 4. Comparison of analytically and numerically obtained solutions of the Moiré interference model.
A Top: unfiltered Moiré interference patterns. Black line separates analytical (left, see Eq (52)) from numerical result (right). Bottom: amplitude spectrum of numerically obtained Moiré interference patterns. Red circle marks k c (cf. Eq (6)), blue circle indicates . Note the high frequency contributions, indicated by the small yellow circles. B Top: Numerically obtained Moiré interference pattern after thresholding for cells with OSI > 0.25 (left, see Methods for the OSI definition used) and subsequent smoothing (right, see text). Inset shows a magnified region of the OSI-filtered domain layout together with the RGC mosaic from which the neurons sample. Bottom: amplitude spectrum of the numerically obtained thresholded and smoothed layout. Red circle indicates k c (cf. Eq (6)). C Orientation domain layout (top) and amplitude spectrum (bottom) obtained by calculating the lowest spatial frequency contributions of the layout in A (Eq (8)). All model parameters as in Fig 3.

