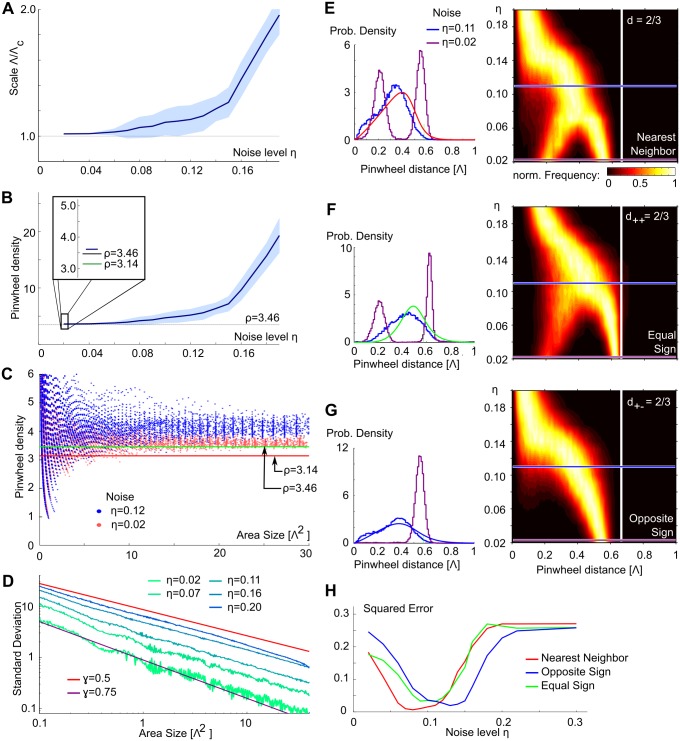
Fig 6. Pinwheel statistics in the Moiré interference model.
A Column spacing Λ estimated by the wavelet method compared to the Moiré scale Λc for different disorder strength. B The pinwheel density ρ as function of disorder strength. Dashed line shows theoretically predicted value . Dark green line in inset shows experimentally observed mean value ρ = 3.14. C Pinwheel density in circular regions of increasing area for η = 0.12 (blue) and η = 0.02 (red). Lines show theoretically predicted and experimentally observed values as in B inset. D The standard deviation of pinwheel density estimates for increasing subregion size. Red line shows a power law fit to the experimental data (γ = 0.5, [23]), purple line indicates a fit to the perfectly ordered hexagonal pinwheel arrangement (γ = 0.75, [23, 92, 93]). E Nearest neighbor (NN) distances for pinwheels irrespective of topological charge. Left: distributions for two disorder strengths (η = 0.11, blue; η = 0.02, purple) and the experimental data (red). Right: Distributions for different disorder strengths. Color encodes the (normalized) fraction of pinwheels at this distance. Blue and purple lines indicate disorder strengths shown on the left. The white line marks the theoretically predicted distance of NN pinwheels (2/3Λc) for vanishing disorder [92, 93]. F same as E for pinwheels of equal charge, data green curve. G same as E for pinwheels of opposite charge, data blue curve. H squared deviation of NN distance distributions to the experimental estimates (shown in E-G, left) as function of disorder strength. All other model parameters as in Fig 3.

