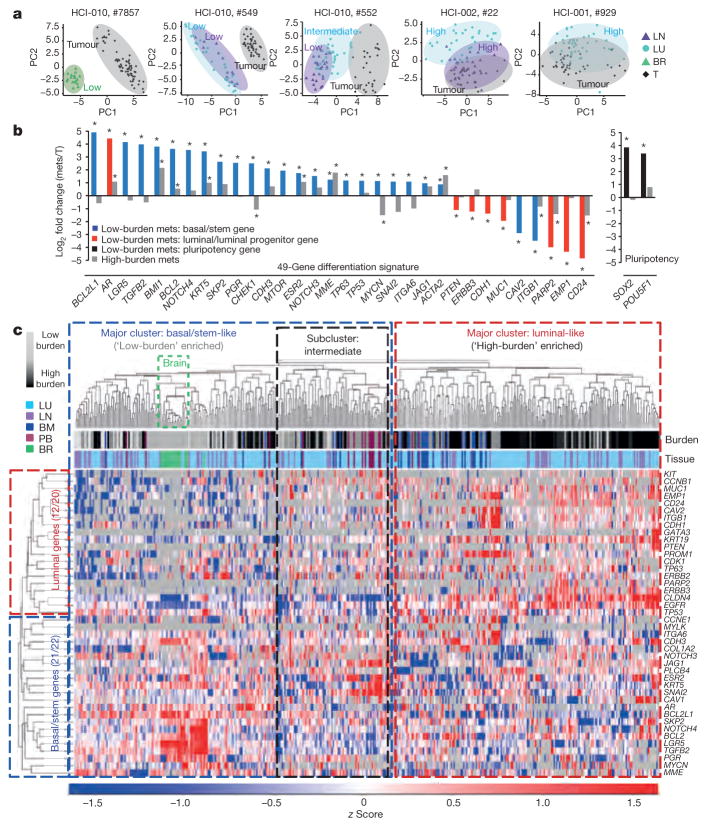
Figure 3. Early stage metastatic cells possess a distinct basal/stem-cell program.
a, PCA plots show metastatic and primary tumour cells in representative mice. Low, high and intermediate indicate burden levels. b, Bar graph shows genes from the 49-gene differentiation signature, and pluripotency genes, that were differentially expressed in low-burden metastatic cells.
*P <0.05, significant relative to primary tumour; primary tumour expression =0. P values and fold change are listed in Extended Data Table 2. Mets, metastases. c, Heatmap and dendrogram show unsupervised hierarchical clustering of metastatic cells and genes from the 49-gene signature that were run on all arrays. BM, bone marrow; BR, brain; LN, lymph node; LU, lung; PB, peripheral blood; T, tumour.

