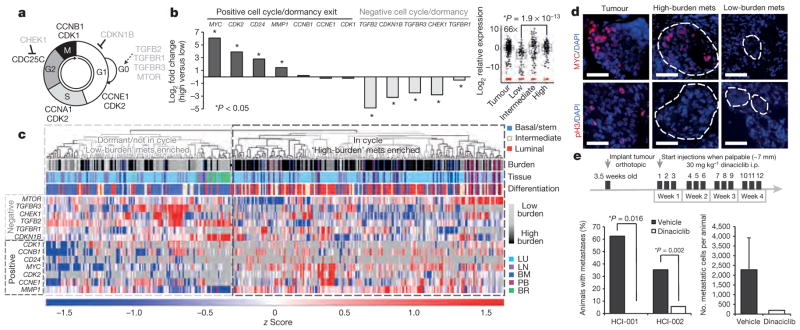
Figure 4. Metastatic progression is blocked by cell cycle inhibition.
a, Schematic of the cell cycle. b, Graph and box plot (MYC) show expression for dormancy and cell-cycle-associated genes. P values: MYC: 1.9 ×10⁻¹³; CDK2: 1.25 ×10⁻⁷; CD24: 0.005; MMP1: 1.08 ×10⁻¹²; TGFB2: 1.28 ×10⁻¹⁶; CDKN1B: 2.63 ×10⁻¹⁴; CHEK1: 2.18 ×10⁻⁶. c, Unsupervised hierarchical clustering of metastatic cells and cell-cycle-associated genes. mets, metastases. d, Immunofluorescence stains for MYC and phospho-histone H3 (pH3) in micro- and macrometastatic lesions. Scale bar, 50 μm. e, Dinaciclib treatment course in PDX mice (top). Graphs show percentage of mice with metastasis, and burden per animal. Error bars, s.d. Only one drug-treated animal developed metastasis, so no P value was generated (right graph).

