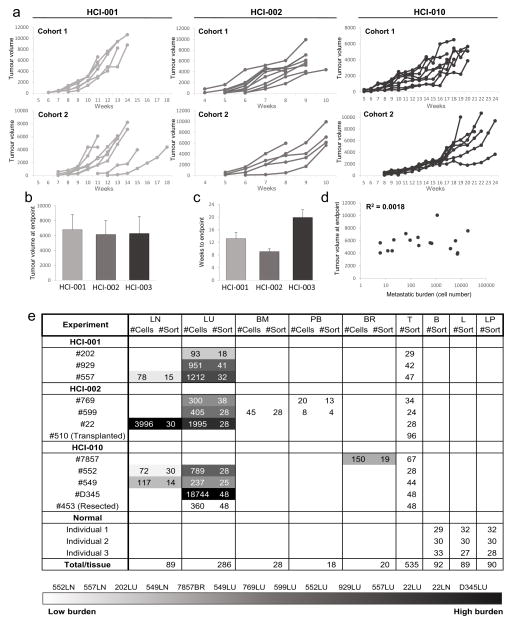
Extended Data Figure 2. Analysis of primary tumour growth kinetics and metastasis in PDX mice.
a, Weekly caliper measurements of primary tumours in two independent cohorts of animals show that growth kinetics were consistent within each PDX model. b, Bar graph shows that the average tumour volume at the endpoint was similar across PDX models. c, Bar graph shows the average number of weeks for tumours to reach endpoint (20–25 mm diameter) in each PDX model. d, Correlation plot shows that metastatic burden did not correlate with tumour volume in PDX animals. e, Table summarizing the number of metastatic cells detected (#Cells) and analysed (#Sort) from each tissue from each PDX animal. Tissues were rank ordered according to metastatic burden, from lowest (lightest grey) to highest (black). The table also shows the number of primary tumour cells analysed (#Sort) from PDX animals, and the number of normal mammary epithelial cells analysed (#Sort) from mammoplasty patients (Individuals 1, 2, and 3). ‘Transplanted’ indicates primary tumour cells derived from transplant of lymph node metastatic cells into marry fat pads; ‘resected’ indicates lung metastatic cells analysed 8 weeks after resection of the primary tumour. B, basal/stem; BM, bone marrow; BR, brain; L, luminal; LN, lymph node; LP, luminal progenitor; LU, lung; PB, peripheral blood; T, primary tumour.

