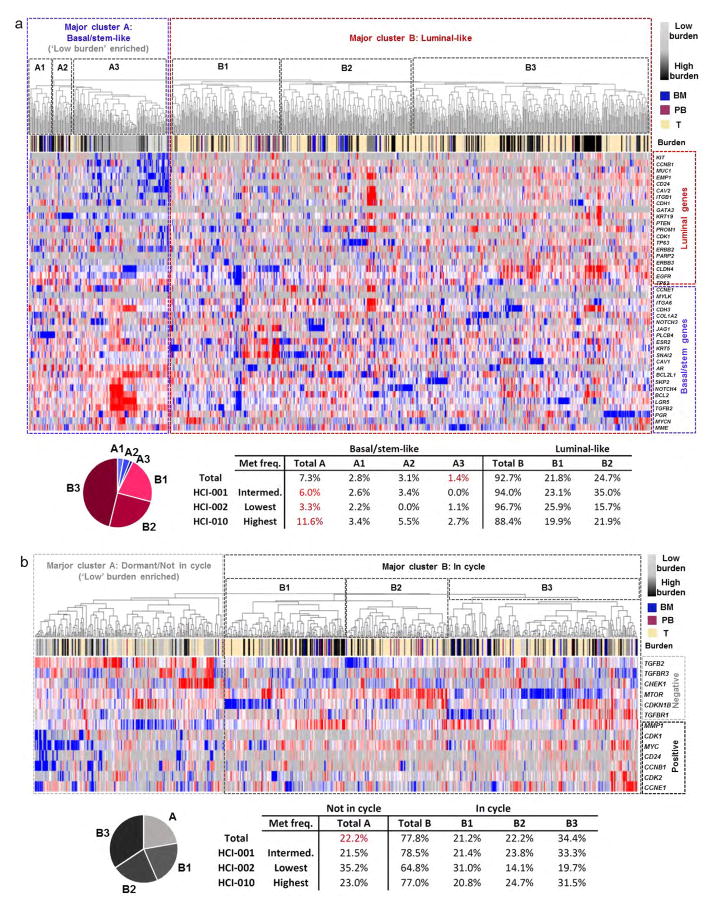
Extended Data Figure 3. Primary tumours contain rare stem-like cells.
a, Unsupervised hierarchical clustering of metastatic and primary tumour cells from 10 animals (Extended Data Fig. 2e lists cells analysed from each animal) based on their expression of the 49-gene differentiation signature. The dendrogram shows two major clusters, where major cluster A contains basal/ stem-like cells and major cluster B contains more luminal-like cells. The majority of low-burden metastatic cells reside in subcluster A3. 1.4% of the primary tumour cells analysed in this study reside in subcluster A3, and are therefore similar to low-burden metastatic cells in their stem-like differentiation status. The pie graph and table list the percentage of primary tumour cells that reside in each cluster. The table also shows the data by PDX model. b, Unsupervised hierarchical clustering of metastatic and primary tumour cells, based on their expression of genes associated with cell cycle and dormancy. Two major clusters are evident. Major cluster A contains cells with a less-proliferative signature, which express higher levels of ‘negative’ cell-cycle-associated genes and lower levels of ‘positive’ cell-cycle-associated genes. Major cluster B contains cells with a more proliferative signature. The majority of low-burden metastatic cells reside in major cluster A, and possess a less-proliferative signature. The pie chart and table show the number of primary tumour cells in each cluster.

