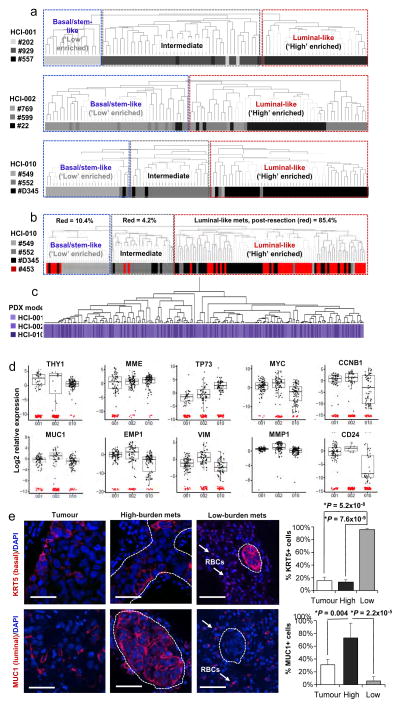
Extended Data Figure 4. The correlation between differentiation and metastatic burden is conserved in each PDX model.
a, Unsupervised hierarchical clustering of lung metastatic cells from each PDX model is shown separately. Lung metastatic cells were specifically chosen for this analysis because they were the only tissue for which there were sufficient numbers of low- and high-burden cells. In each dendrogram, low-burden metastatic cells form a distinct cluster due to their basal/stem-like expression signature. High-burden metastatic cells also form distinct clusters and express higher levels of luminal genes. Supplementary Data 2 shows the entire heatmap for each PDX model. b, Unsupervised hierarchical clustering of lung metastatic cells that developed after primary tumour resection (#453, red) at 10–12 mm in diameter. Post-resection metastatic cells were clustered with lung metastatic cells from non-resected animals to investigate their differentiation status. All animals bore the HCI-010 model. 85.4% of post-resection metastatic cells displayed a luminal-like expression pattern, showing that luminal-like metastatic cells can arise from cells that disseminate at early stages of primary tumour growth. Supplementary Data 2 shows the entire heatmap. c, Unsupervised hierarchical clustering of lung metastatic cells from all three PDX models by their expression of the top genes differentially expressed between them. Although there were statistically significant differences between the models, the dendrogram shows that they were not powerful enough to cluster the cells separately by model. Supplementary Data 2 shows the entire heatmap. d, Box plots show top selected genes differentially expressed between the three PDX models. By ANOVA, 53 genes were significantly differentially expressed (P <0.05, Supplementary Data 3). e, Immunofluorescence stains for basal and luminal lineage-specific proteins (red) in micro- and macrometastatic lesions. Autofluorescent red blood cells (RBCs) are also present in the lung (arrows), but do not represent positive immunostaining. Scale bars, 50 μm. Bar graphs quantify the percentage of low- and high-burden metastatic cells, and primary tumour cells that were positive for antibody staining. Data from at least three fields, in three different mice was collected from each group, and P values were calculated as described in the Methods. Error bars represent standard deviation.

