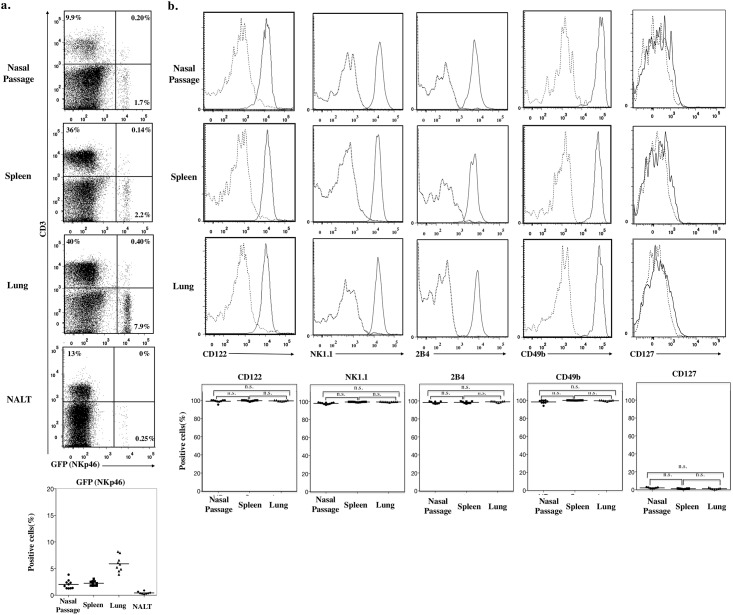
Fig 2. Nasal NKp46+ cells are NK-lineage cells.
a. Flow cytometry of CD45+ cells from nasal passage, spleen, lung, and Nasopharynx associated lymphoid tissue (NALT) of Ncr1 GFP/+ mice stained with CD3. Numbers in quadrants indicate the percentages of cells in each. Dot plot below shows percentage of GFP (NKp46)+ cells in CD45+ cells from nasal passage, spleen, lung, and NALT. b. Flow cytometry of CD3−NKp46+ cells from spleen, lung, and nasal passages stained with CD122, NK1.1, 2B4, CD49b, and CD127. Continuous lines, specific antibodies; Dashed lines, isotype-matched control antibodies. Dot plot below shows the percentage of positively stained cells. Bar, mean; n.s.; not significant (Mann-Whitney U test with Ryan’s multiple comparison method). Data are obtained from at least 3 independent experiments.

