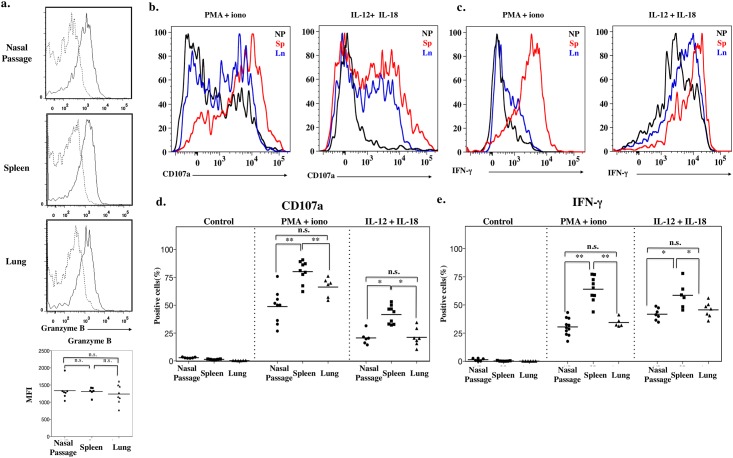
Fig 5. Impaired effector function of nasal NK cells.
a. Intracellular expression of granzyme B by CD3−NKp46+ cells. Dashed line, isotype-matched control antibody; solid line, specific antibody. Dot plots below shows the mean fluorescence intensity (MFI). b, c. Intracellular staining of (b) CD107a and (c) IFN-γ production by lymphocytes isolated from nasal passage, spleen, and lung and stimulated for 4 h with various stimuli. Isolated lymphocytes were stimulated and then stained for surface antigen followed by intracellular staining. Signal assessed by gating on CD3−NKp46+ cells. Black line, nasal passage; red line, spleen; blue line, lung. d, e. Dot plots showing the percentage of positively stained cells after stimulation. Control, isotype matched control; PMA/iono, phorbol-12-myristate-13-acetate and ionomycin. Bar, mean; n.s.; not significant; *, P < 0.05 **, P < 0.01 (Mann-Whitney U test with Ryan’s multiple comparison method). Data are obtained from at least 3 independent experiments.

