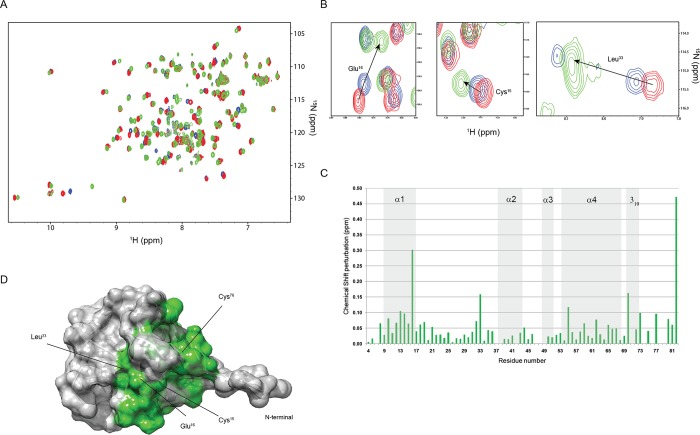
Fig 9. Structural rearrangement of RpfCc monitored by NMR spectroscopy.
(A, B) Overlay of the 1H-15N HSQC spectra acquired at pH 7 (red), pH 5 (blue) and pH 3 (green). (C) Chemical shift changes (ppm) plotted versus the primary sequence. (D) Chemical shift perturbation mapping onto the RpfCc NMR structure.

