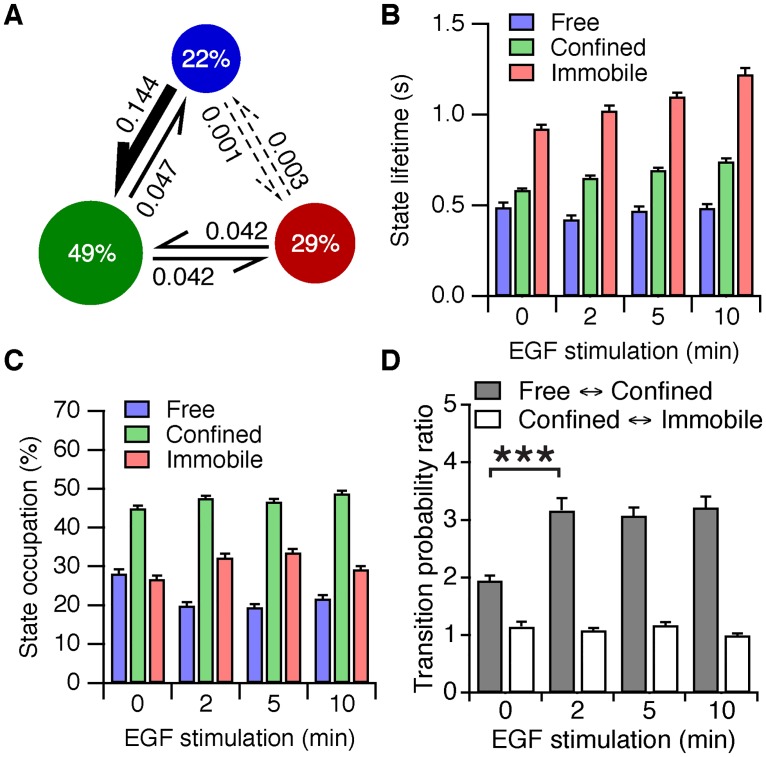
Fig 3. vbSPT analysis of Cy3-SNAP-EGFR tracks.
(A) Results of the vbSPT algorithm after 10 minutes of stimulation with 16 nM EGF. Circles: percentages of particles in the state (state occupations). Arrows: probabilities to switch to another state between frames (transition probabilities). Dashed arrows indicate transition probabilities < 0.01. (B) Lifetime of the mobility states, as a function of EGF stimulation, calculated from the classified track segments. (C) State occupations as a function of EGF stimulation. (D) The ratio of the forward to the backward probabilities, for the transitions between the free and the confined states, and for the transitions between the confined and the immobile states. ***P < 0.001, t test. n = 43 cells per time point. Error bars denote SEM.

