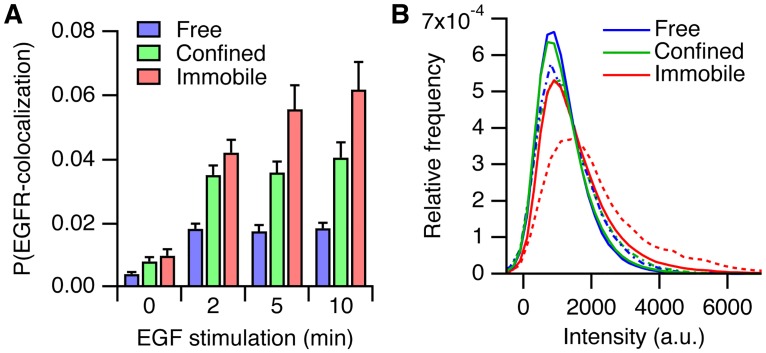
Fig 4. Quantification of EGFR aggregation.
(A) Probability of colocalization between Cy3-SNAP-EGFR and Alexa488-SNAP-EGFR. (B) Normalized intensity histograms of the Cy3-SNAP-EGFR intensity, for all particles (continuous lines) and for the particles that colocalized with Alexa488-SNAP-EGFR (dashed lines) after 10 minutes of EGF stimulation. n = 43 cells per time point. Error bars denote SEM.

