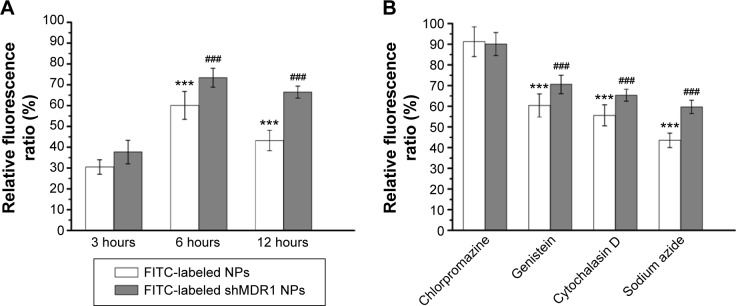
Figure 5.
Analysis of the uptake mechanism of nanoparticles (NPs) in gefitinib-resistant Hela cells.
Notes: (A) Fluorescence spectrum analysis of the uptake of NPs in gefitinib-resistant Hela cells. Results are expressed as means ± standard deviation (n=3). ***P<0.001 vs fluorescein isothiocyanate (FITC)-labeled NPs treated with cells at 3 hours. ###P<0.001 vs the FITC-labeled shMDR1 NPs treated with cells at 3 hours. (B) Effects of endocytic inhibitors on the uptake ability of the two NPs in gefitinib-resistant Hela cells. Results are expressed as means ± standard deviation (n=3). ***P<0.001 vs FITC-labeled NPs treated with chlorpromazine. ###P<0.001 vs the FITC-labeled shMDR1 NPs treated with chlorpromazine.

