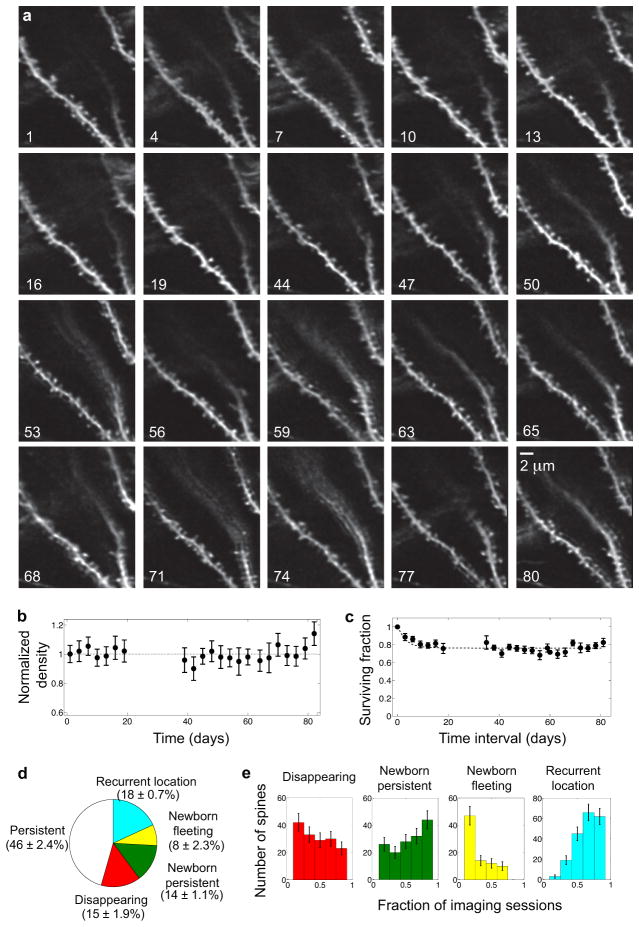
Extended Fig. 1. In vivo imaging of CA1 spine dynamics over extended time intervals.
(a) In vivo, 80-day-long time-lapse image dataset sampled at variable intervals. Each image shown is the maximum projection of 4–8 images acquired at adjacent z-planes. Scale bar is 2 μm.
(b, c) Direct empirical determinations of spine density (b), and spine survival (c), across the 80 days. Data points are mean ± s.e.m.
(d) In vivo, 22-day-long time-lapse image dataset sampled every three days. Over 50% of the spines underwent visually noticeable dynamic changes. Pie chart shows the proportions of spines that were persistent or exhibited different patterns of turnover (N = 1075 total spines from 4 mice). Color-coding is the same as in Fig. 1d. Error bars are s.e.m.
(e) Histograms show the distributions, for each class of spines, of the fraction of imaging sessions in which each spine was observed within the same 22-day dataset of panel d. Color-coding is the same as in Fig. 1d. Error bars represent s.d. estimated as counting errors.

