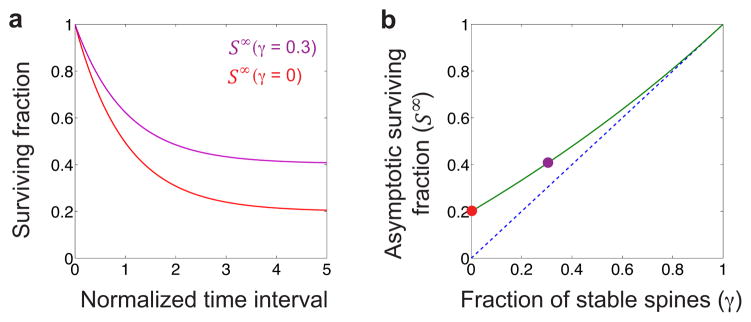
Extended Fig. 4. The asymptotic value of the surviving fraction of spines exceeds the fraction of permanent spines.
(a) Surviving fraction curves for models in which the fraction of permanently stable spines is γ = 0 (red curve) and γ = 0.3 (purple curve) (Supplementary Methods, §I). The time scale of spine survival was τ = 1, and the filling fraction value was f = 0.2. The surviving fraction asymptotes to a value, S∞, that encodes the fraction of stable spines. (Supplementary Information has a list of all mathematical variables used in this work, and their definitions).
(b) The time asymptotic value of the surviving fraction (green curve) exceeds the fraction of stable spines (dashed blue line). Colored circles correspond to the surviving fraction curves plotted in (a).

