
Fig. 3.
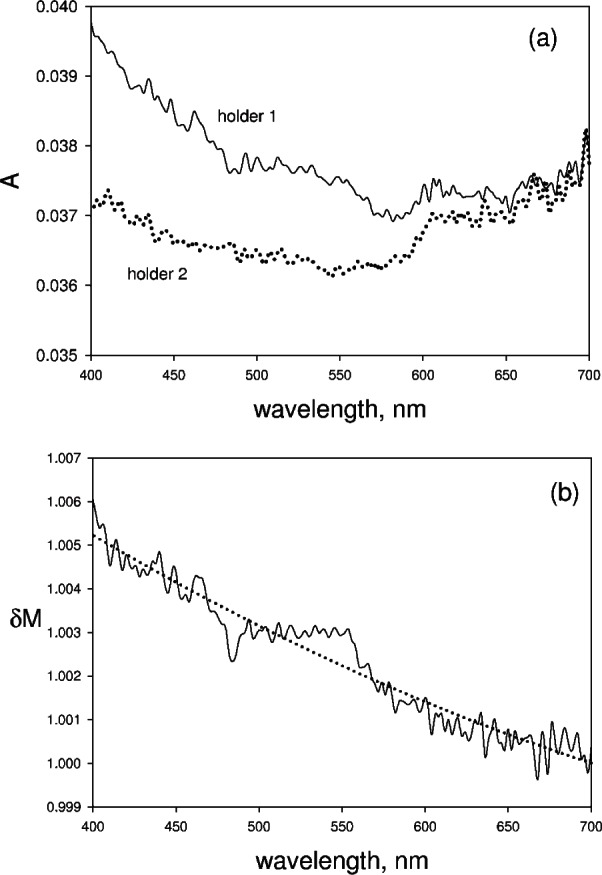
Figure 3a, the solid trace shows the measured absorbance from a cuvette filled with water and placed in holder 1. The dotted trace in Fig. 3a shows the measured absorbance when the same cuvette is placed in holder 2. The discussion following Eq. (9) in the text indicates how the two measurements can be used to estimate the change in IS magnification factor due to the presence of a cuvette at the sample entrance aperture. The solid trace in Fig. 3b shows the estimated change in magnification factor δM obtained from the data in Fig. 3a. The change is less than 1 %. The dotted trace in Fig. 3b is a fit to the data using a second order polynomial.