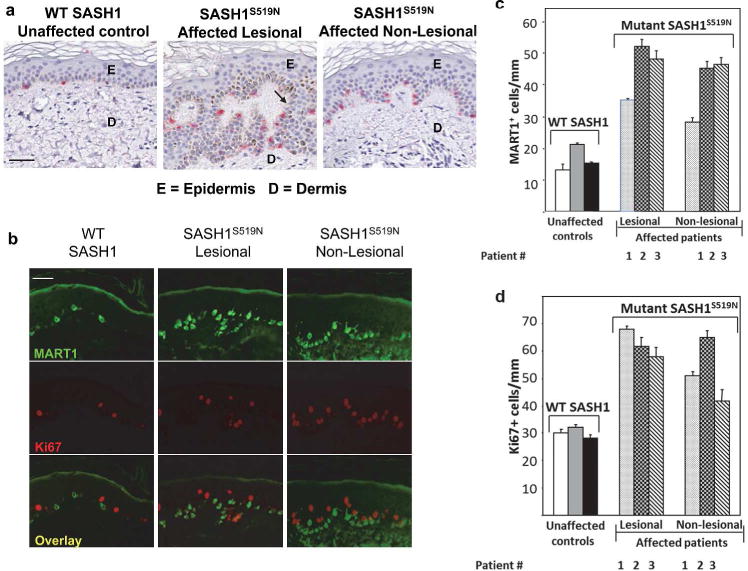
Figure 2. Histological examination indicates a lentiginous phenotype in the skin from affected individuals.

(a) The images of immuno-histochemistry staining with the melanocyte marker (MART1 in red) for the skin biopsies were collected from non-photoexposed skin of ventral forearms of an unaffected individual, and from lesional (hyper-pigmented area) and adjacent non-lesional area (1 cm or more distant normal-appearing skin) tissue from the same affected patient. Scale bar = 50 um. The upper, epidermal layer is indicated by “E”, the lower dermal layer is denoted “D”, and the arrow points to the rete ridges. (b) The same skin biopsies as in panel (a) were double-stained with antibodies to the melanocyte marker, MART1 (green), and the proliferation antigen, Ki67 (red). Scale bar = 50 um. The quantification of the MART1 (c) or Ki67 (d) staining in panel (b) was performed by counting the number of positively stained cells per millimeter of tissue across the entire length of the tissue biopsy. Three affected patients and three unaffected siblings were biopsied. Panel c shows a greater than two-fold increases in MART1 staining in the skin for all affected patients as compared to controls, and panel d shows a greater than two-fold increase in Ki67 staining in the skin for all affected patients as compared to controls. Increased proliferation was also apparent in affected patients in non-lentiginous areas.
