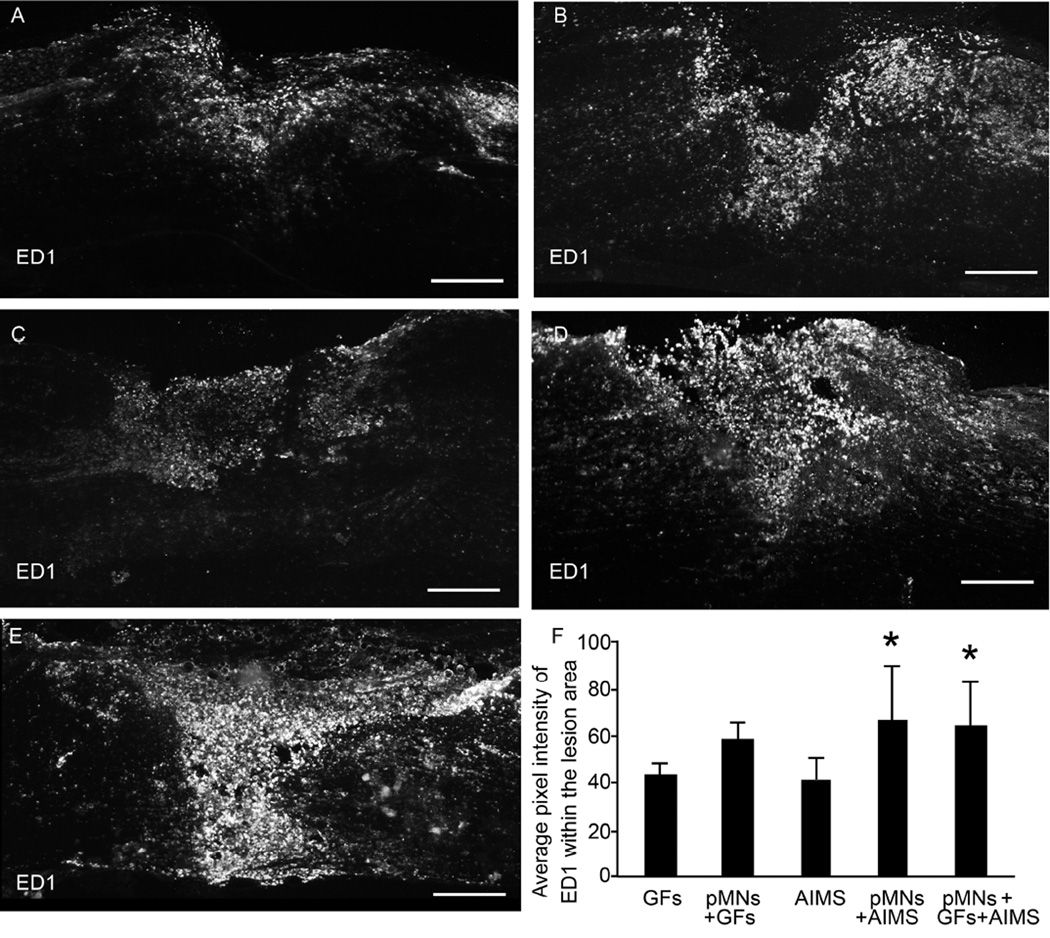
Figure 3. Effect of combining pMNs and AIMS on macrophage infiltration as assessed by ED1 staining.
(A–E) Representative images of 20 µm thick sections of ED1 (marker for activated inflammatory cells) staining within and around the lesion site for groups containing (A) GFs, (B) pMNs+GFs, (C) AIMS, (D) pMNs+AIMS, (E) pMNs+GFs+AIMS. Positive staining for ED1 appears higher in groups containing both pMNs and AIMS. (F) The average pixel intensity of ED1 stained sections within the lesion area was determined. Fibrin scaffolds with pMNs+AIMS had significantly higher ED1 staining compared to AIMS. Error bars are standard deviation. * denotes p<0.05 versus the AIMS group. Scale bar is 250 µm.

