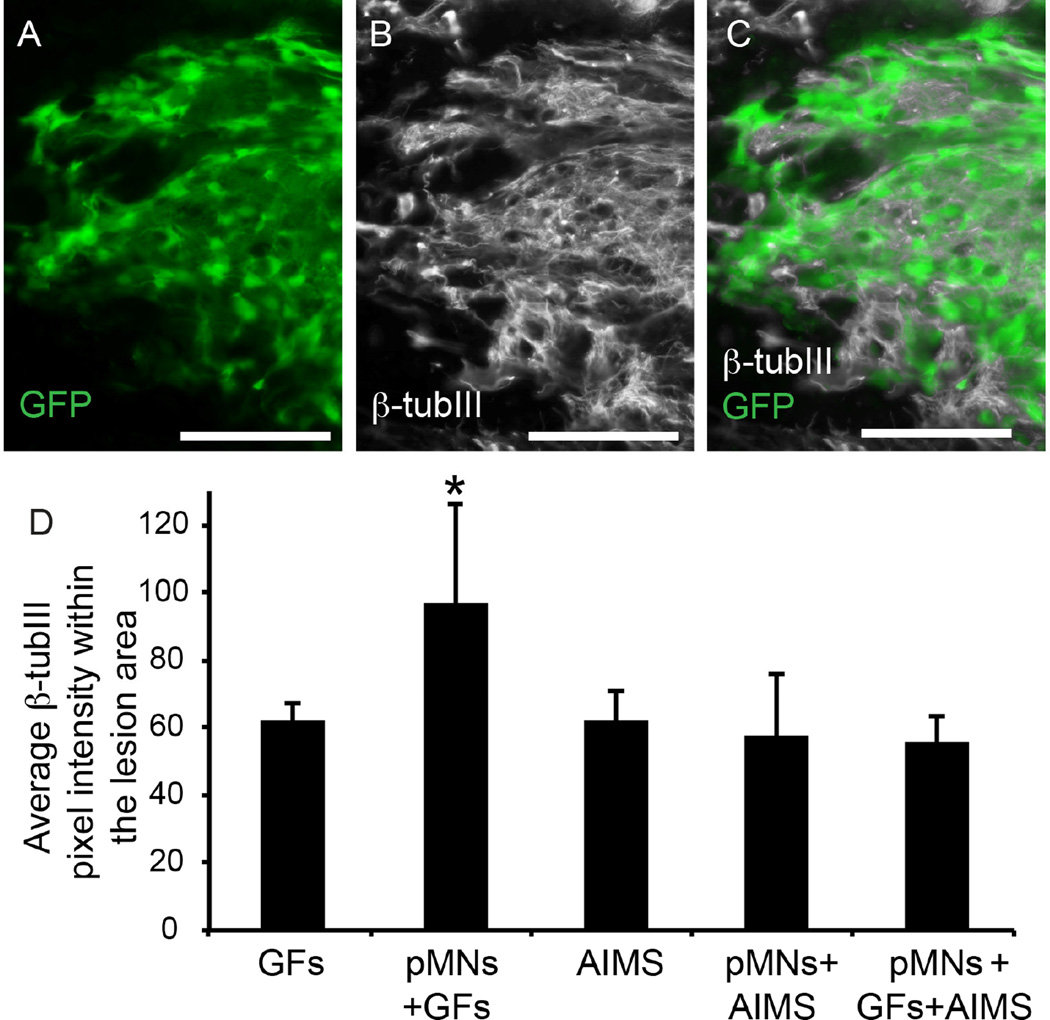
Figure 5. Spinal cord sections show colocalization of neuronal extensions and GFP+ areas.
(A–C) Representative images of GFP expression and a marker for neurons, β-tubIII, from GFs+pMNs group (A) and β-tubIII staining (B) that shows colocalization when merged together (C). Robust β-tubIII staining was observed overlapping with GFP+ areas. (D) The average pixel intensity of β-tubIII staining in sections within the lesion area was determined. Error bars are standard deviation. Scale bar is 100 µm. * denotes p<0.05 versus all other groups.

