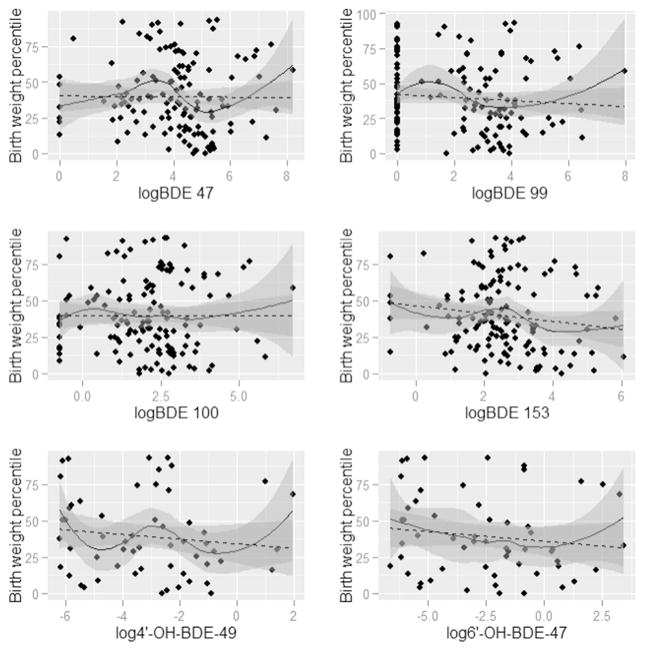
Fig. 3.
LOESS smoothed curves between each PBDE1 (nanograms per gram lipid) and birth weight percentile for gestational age, overlaid on a scatter plot of the observed values. (N = 1372). 1Each PBDE was log base 2 transformed. 2The N for phenolic metabolites (6′-OH-BDE-47, 4′-OH-BDE-49, and ΣOH-BDE) is 57.

