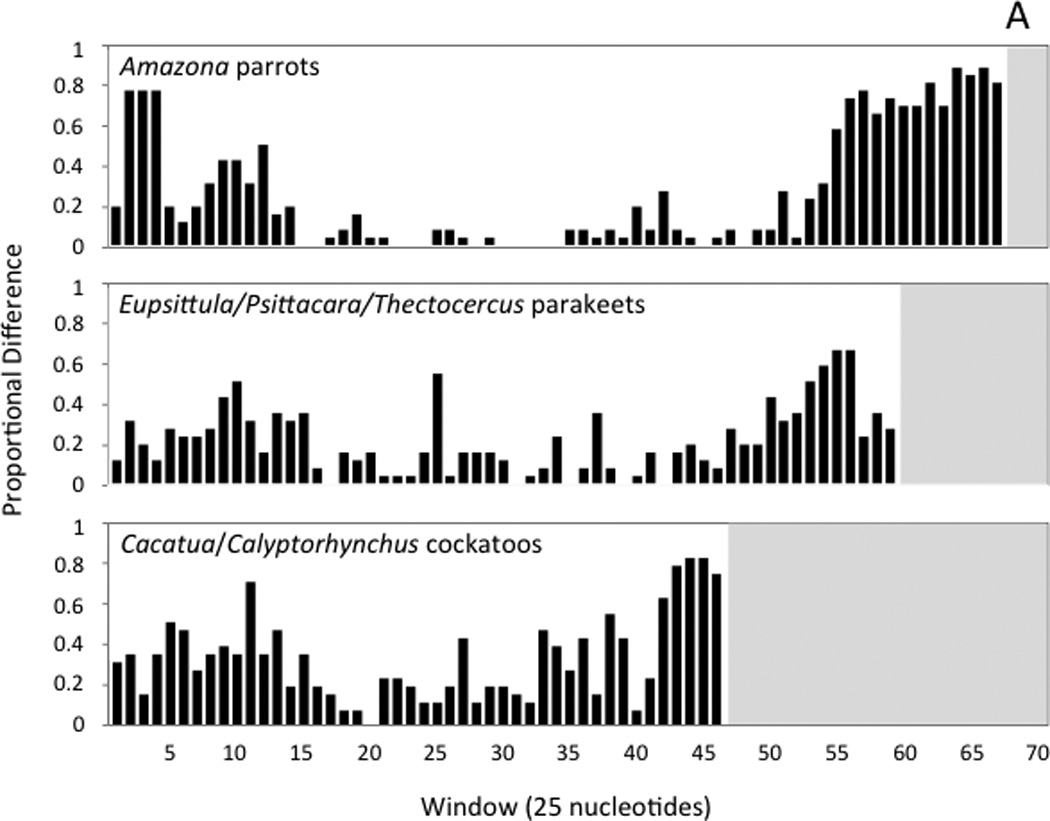
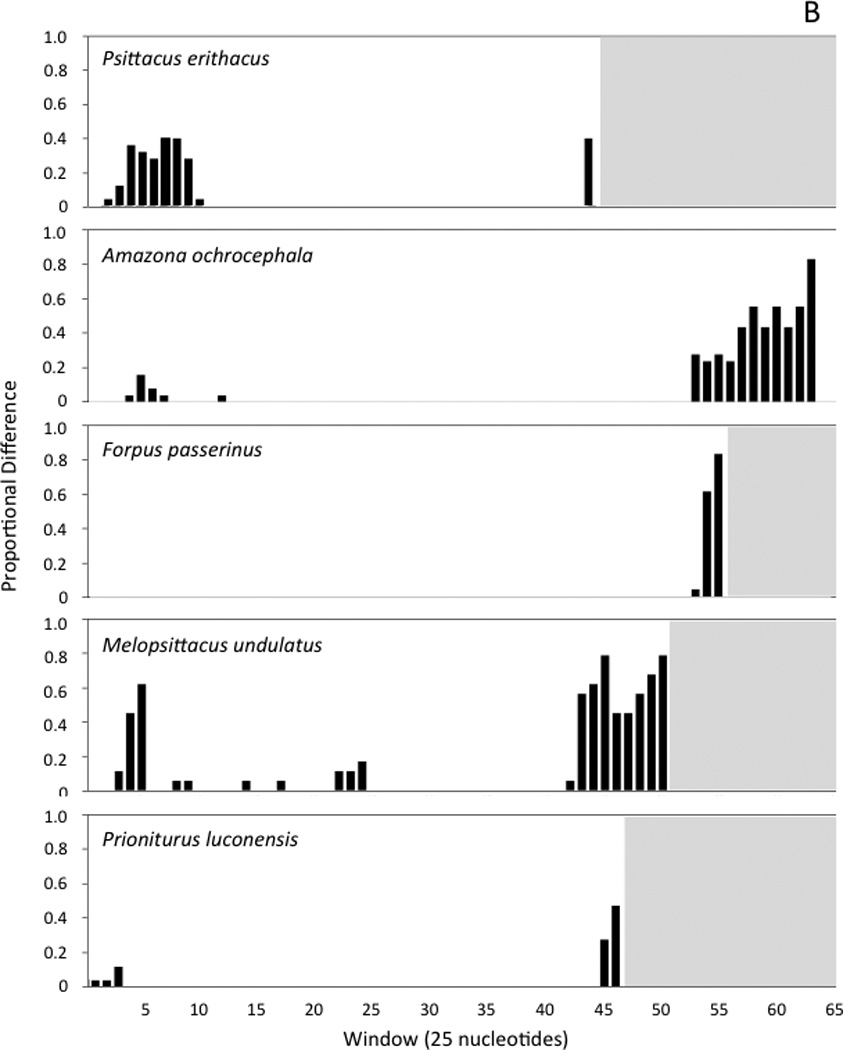
Fig. 4.


Histograms showing the number variable nucleotide positions as a proportion of the changes possible in each 25-nucleotide window of the sliding-window analysis. Windows are numbered, with the first window starting at the poly-C sequence near the 5’ end of the control region. Panel A shows the results of sliding window analyses performed with the control regions of three sets of closely related taxa (see text). Panel B shows the comparisons of the two control region copies found within individual genomes for five taxa that have duplicate control regions. In each histogram, the white background indicates the interval spanned by a given control region; since control regions differ in length, the number of 25-nucleotide windows is different in each case.
