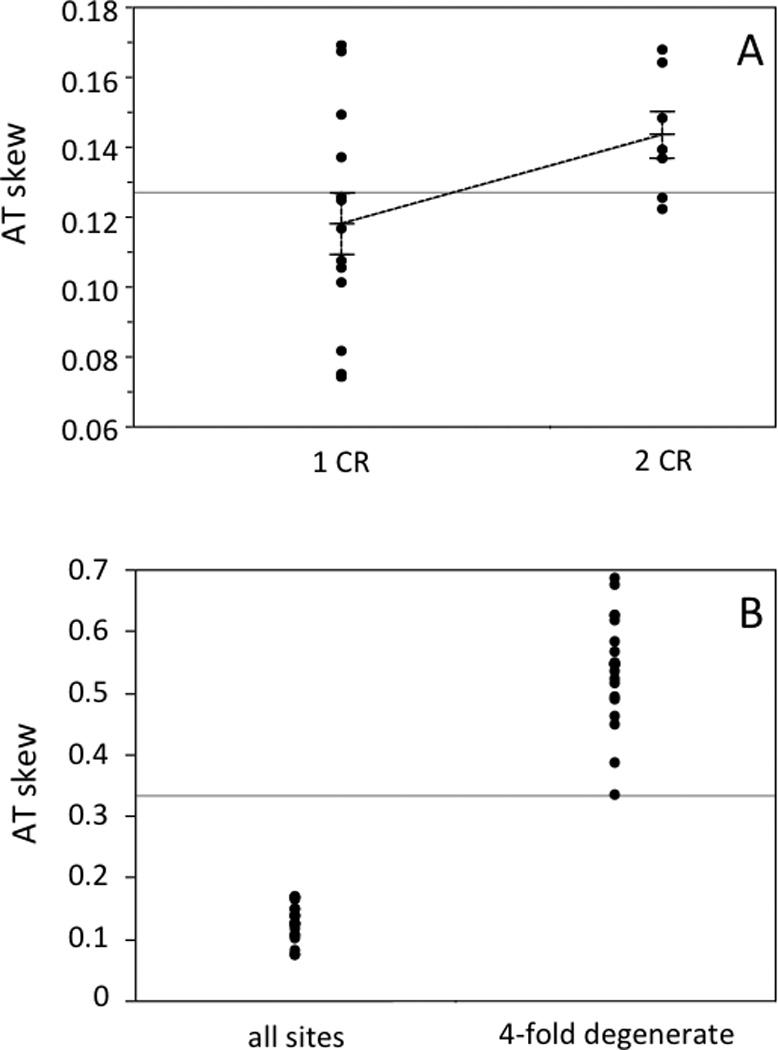
Fig. 5.

AT skew for the H-strand protein coding genes of 20 parrot mitochondrial genomes. A) Nucleotide skew was calculated using the formulae of Perna and Kocher (1995) for all sites. Data are grouped according to the number of control regions in a given genome, and each group’s mean is indicated, along with standard error bars based on the standard error of the mean. B) AT skew values are shown for all genomes, calculated using all sites and using only 4-fold degenerate sites.
