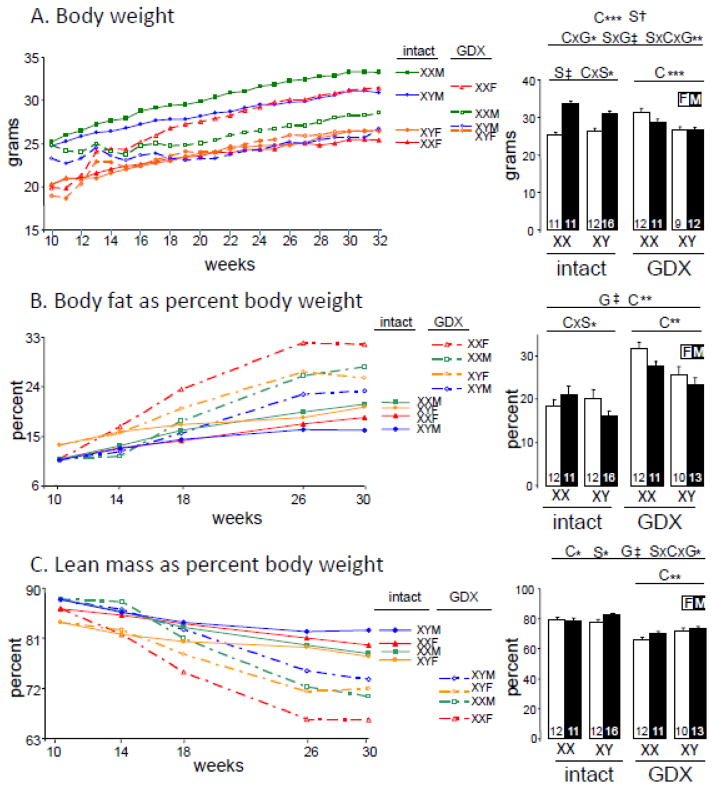
Fig. 1.
Body weight and composition in gonad-intact and GDX mice. Mice were GDX or not at 75 days of age (10 weeks) and then measured until 30–32 weeks of age. A. Body weight. B. Body fat expressed as percentage of body weight. C. Lean mass expressed as percent of body weight. F, gonadal female. M, gonadal male. On right side are final measurements at 32 weeks of age for body weight, or body fat and lean mass at 30 weeks of age. Group size is shown at the bottom of histogram bars. Results of the 3-way ANOVA for all groups (horizontal line above spanning all groups), and of 2-way ANOVAs for gonad-intact alone or GDX alone (horizontal lines above spanning only each condition), indicate significant effects (when present) of G (gonadal status, intact vs. GDX), S (gonadal sex, female vs. male), or C (sex chromosome complement, XX vs. XY). Significant interactions are shown as GxS, GxC, SxC, or GxSxC, * p<0.05, ** p<0.01, *** p<0.001, † p<0.0001, ‡ p<0.00001.

