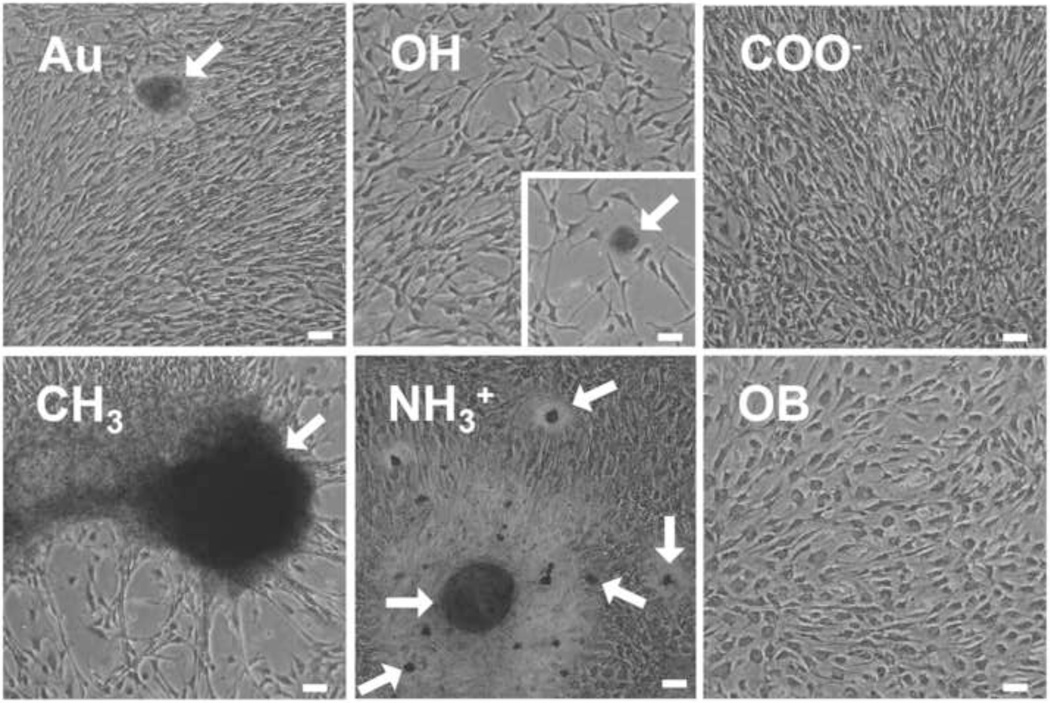
Figure 3.
Bright field (phase contrast) representative images of cell morphology on varying surfaces chemistry compared to gold (Au) and osteoblastic controls over seven days of growth. Day 5 and 7, insets show morphology and relative size of nodules formed in culture, COO− surfaces did not show any nodule formation over the course of this study. Further images can be found in online data supplement. Scale = 50 µm, inset images same scale.

