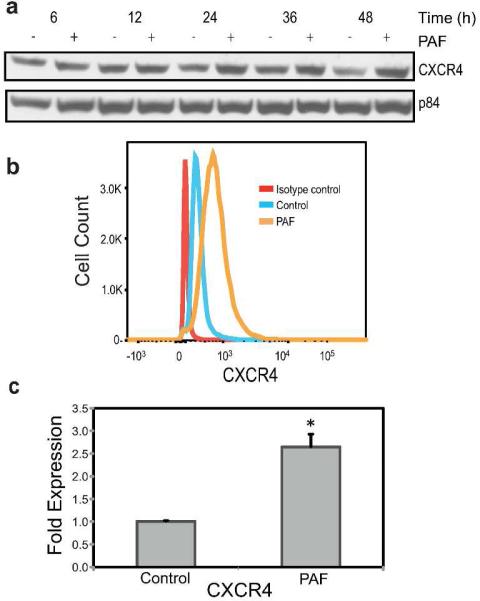
FIGURE 1.
CXCR4 expression in PAF-treated HMC-1 cells. (a) Immunoblotting analysis of CXCR4 protein expression 6 to 24 hours after cPAF (10 μM) treatment. p84 was the loading control. (b) Flow cytometry was used to measure CXCR4 surface expression 24 hours post cPAF treatment. (c) CXCR4 mRNA levels were increased 24 hours post cPAF treatment. Data represent the mean ± SEM (N=3), *p < 0.05 vs. control (Student's t-test).

