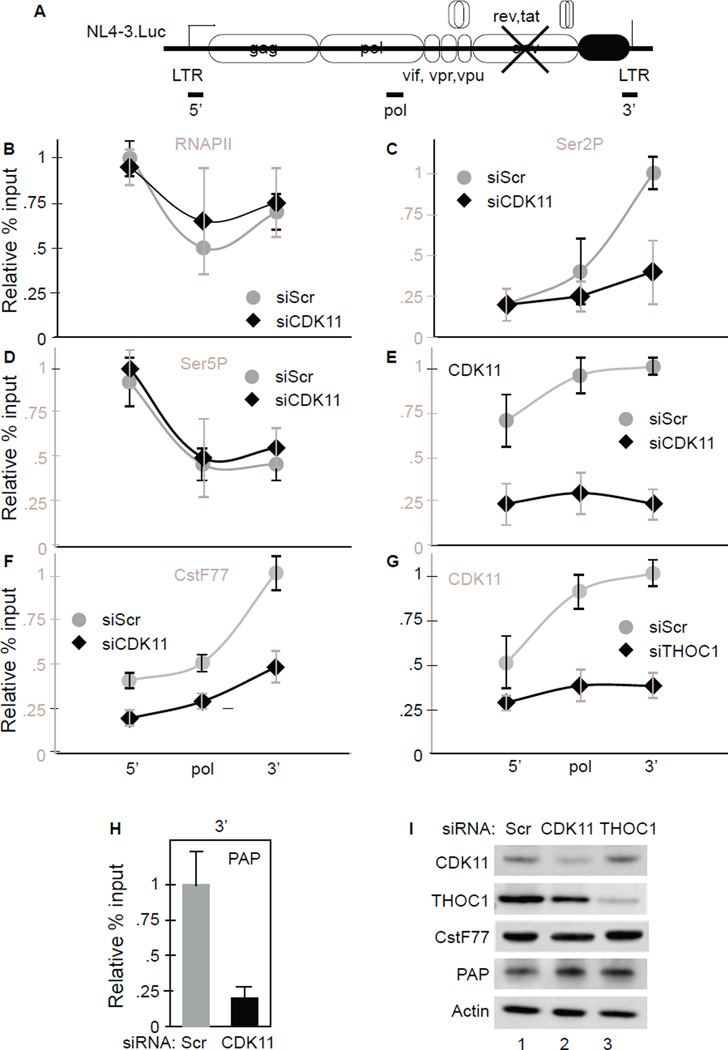
Figure 5. Knockdown of CDK11 decreases levels of Ser2P and CPA factors at the HIV 3’ end in HeLaP4 cells.
A. Schematic representation of the NL4-3.Luc. Horizontal lines beneath the gene represent regions amplified by qPCR after ChIPs.
B, C, D, E, F, H. Effects of CDK11 depletion and THOC1 depletion (G) on levels of RNAPII, Ser2P, Ser5P, CDK11, CstF77 and PAP at the HIV gene. ChIPs were performed using indicated antibodies in cells expressing the NL4-3.Luc and treated with siCDK11 or siTHOC1 (black diamonds and lines) and compared to those treated with siScr RNA (gray circles and lines). Sequences corresponding to the HIV 5’ end, Pol, and 3’ end were amplified by qPCR. Values represent percentage of input normalized to IgG levels. See also Figure S4.
I. Confirmation of depleted proteins. Presented are western blots of CDK11, THOC1, CstF77 and PAP in cell lysates, where actin represents the loading control.

