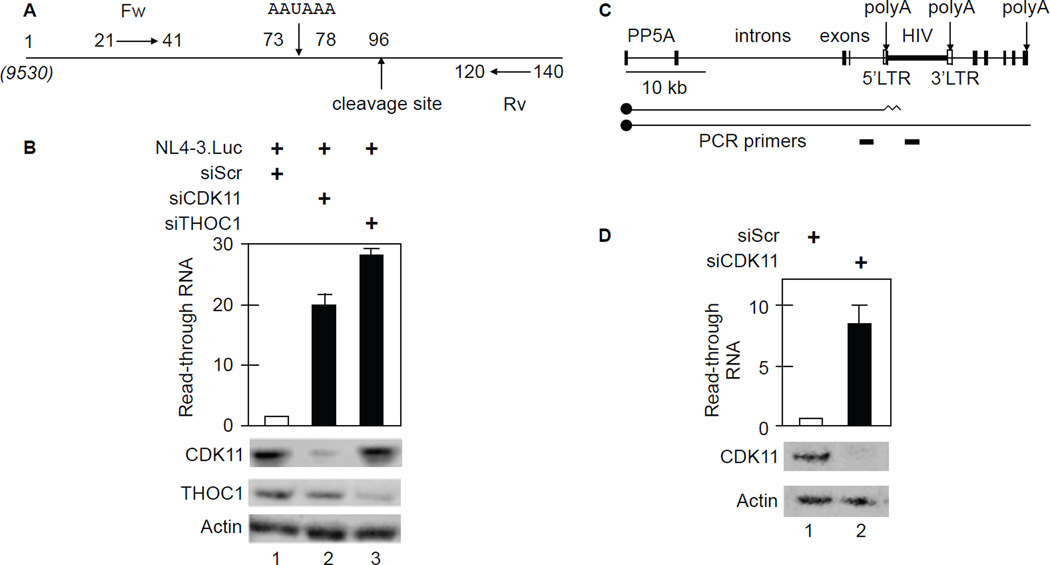
Figure 6. Knockdown of CDK11 or THOC1 increases HIV 3’end read through transcription in HeLa P4 and J-Lat 9.2 cells.
A. Schematic representation of primers used for the HIV 3’ end read through assay. Note that position 1 corresponds to position 9530 from the 5’ HIV LTR. Locations of polyA and cleavage sites are depicted by arrows. Fw and Rv are forward and reverse primers, respectively.
B. Knockdown of CDK11 or THOC1 increases read through of HIV transcripts. Black bars represent fold-increased read-through over WT cells. Error bars represent the mean +/− SE, n = 3. Western blots of CDK11 and THOC1 with actin as the loading control are presented below the bar graph.
C. Schematic representation of the PP5 gene and the integrated HIV in J-Lat 9.2 cells. Two different capped (black circles) transcripts are diagrammed below the gene, those that terminate in the 5’ HIV LTR and those that read through into the viral coding sequences. PCR primers for RT-qPCR are presented below primary transcripts.
D. CDK11 depletion increases read through transcription past the 5’ HIV LTR in J-Lat 9.2 cells. Black bar and error bars are as in panel B. Western blots of CDK11 with actin as the loading control are presented below the bar graph.
See also Figure S5.

