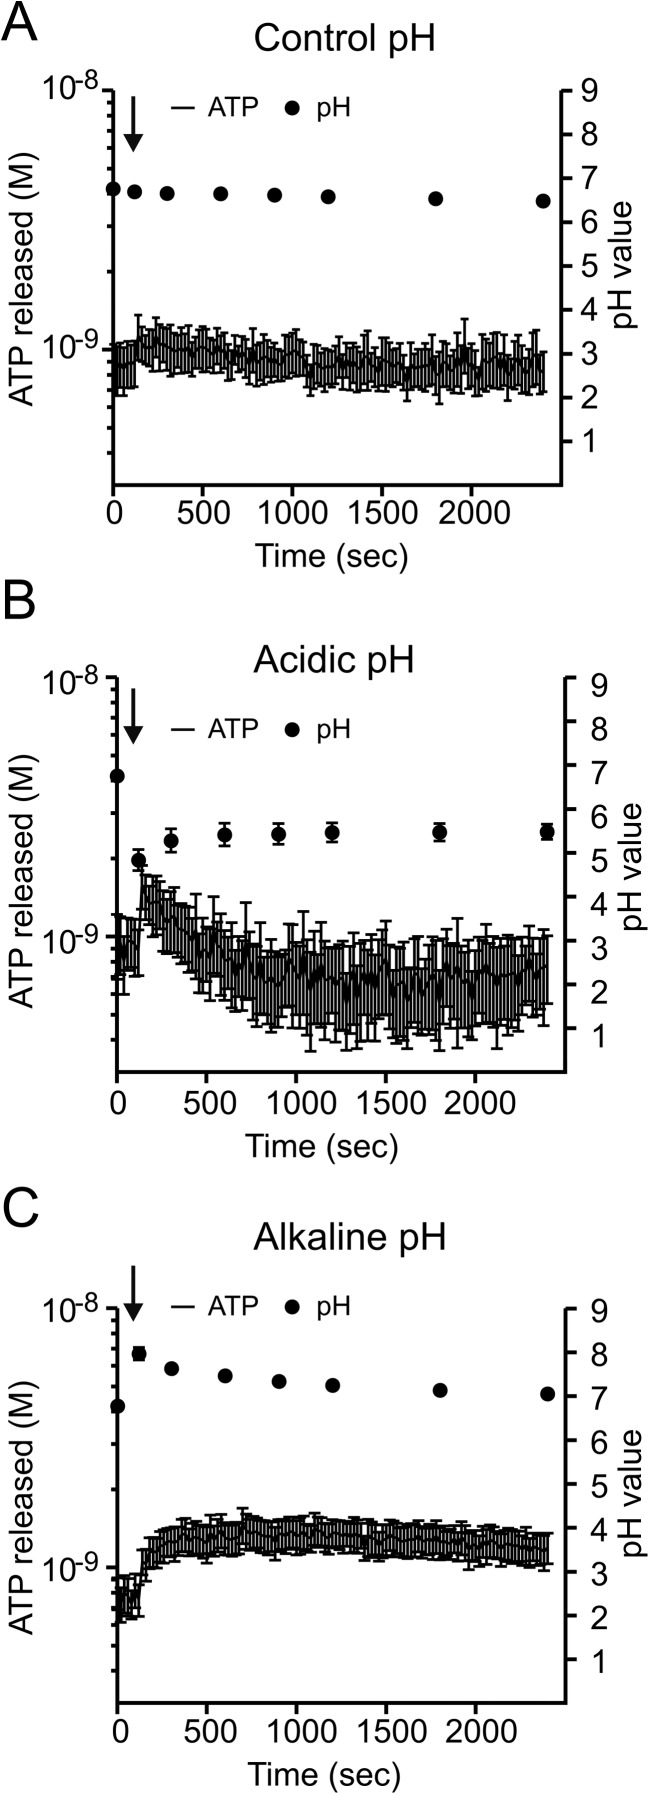
Fig. 1.
The pH effect on ATP release. The original time course traces of ATP released from Capan-1 cells after stimulation with extracellular pH changes: physiological (a), acidic 0.45 ± 0.11 (b) and alkaline 0.51 ± 0.09 (c), respectively (n = 8). The left axis shows the ATP concentration values corrected per 106 cells in 1 ml. The right axis represents the values of extracellular pH showed as grey dots. Arrows indicate addition of acid/base solutions

