Fig. 9.
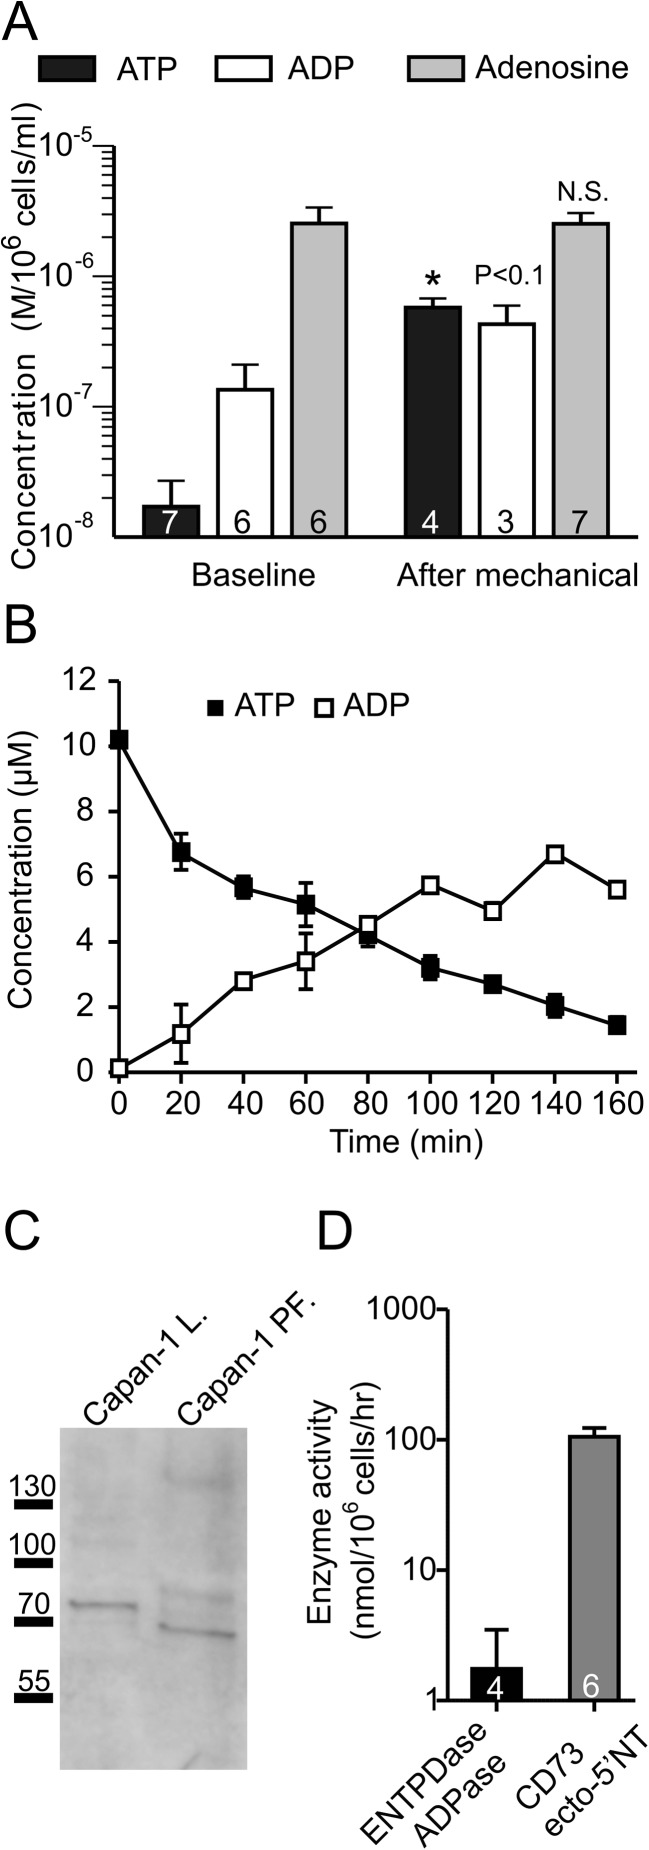
The extracellular concentration of adenine derivatives and activity of nucleotide-hydrolysing enzymes in Capan-1 cells. a Analysis of extracellular concentrations of ATP, ADP and adenosine in unstimulated conditions (n = 6–8) and after mechanical stimulation (n = 3–7) in Capan-1 cells. b The net values of concentrations of extracellular ATP (full squares) and ADP (empty squares) released from Capan-1 cells during 160 min after stimulation of Capan-1 with 10 μM of ATP (n = 2). c Western blot analysis of expression NTPDase2 in Capan-1 cells (Capan-1 lysate) and secreted form present in particulate fraction. d The rates of nucleotides hydrolyses were determined by TLC using 400 μM [3H]ADP (NTPDase/ADPase, n = 4) and 300 μM [3H]AMP (AMPase/CD73, n = 6) as initial substrates. The enzyme activities are presented as bar graph expressed as nanomoles of 3H-nucleotides hydrolysed by 106 cells per 1 h. Results are given as mean net values ± SEM

