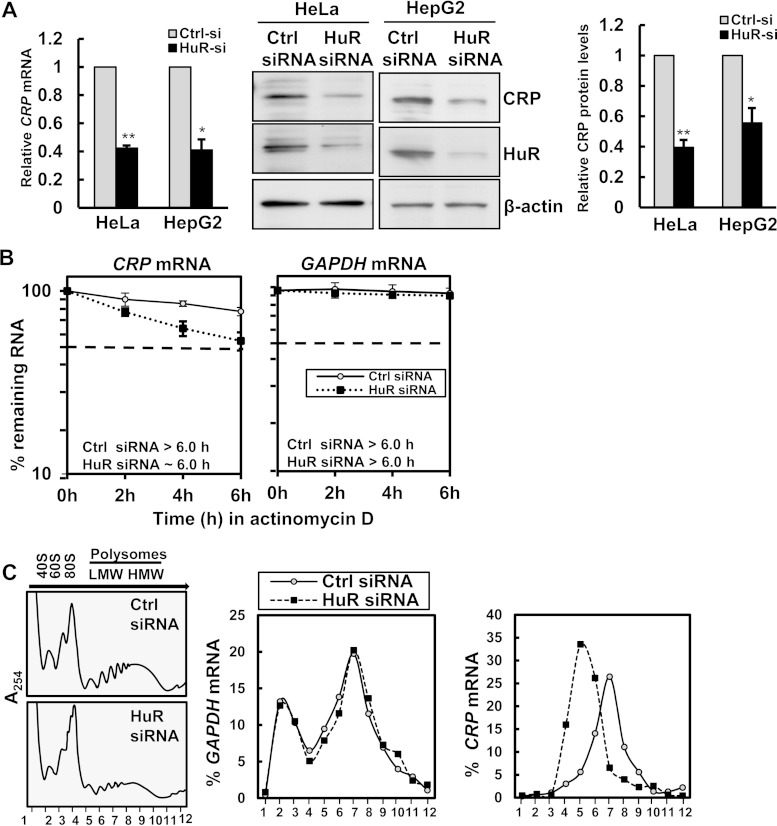
FIG 2.
HuR promotes CRP mRNA stability and translation. (A, left) Forty-eight hours after transfection of HeLa and HepG2 cells with either control siRNA or HuR siRNA, CRP mRNA levels were measured by RT-qPCR analysis. (Right) Transfected HepG2 cells or HeLa cells were assessed by immunoblotting using anti-CRP, anti-HuR, and anti-β-actin antibodies as a loading control. CRP protein levels were quantified from immunoblots and normalized to the levels of actin. Histograms represent the means and standard errors of the means from three independent experiments. *, P < 0.05; **, P < 0.01 (compared to control siRNA, as determined by Student's t test). (B) HeLa cells transfected as described for panel A were treated with actinomycin D (2 μg/ml), and RNA was isolated at the times indicated. The CRP mRNA and GAPDH mRNA levels were assessed by RT-qPCR and normalized to 18S rRNA levels. The t1/2 values for CRP and GAPDH mRNAs were quantified by measuring the time needed for the transcript levels to reach 50% of their original abundance at time zero. (C) HeLa cells transfected with either control siRNA or HuR siRNA were fractionated into cytoplasmic extracts through sucrose gradients. The arrow indicates the direction of sedimentation. Small (40S) and large (60S) ribosomal subunits and monosomes (80S) in fractions 2 to 4 and progressively larger polysomes from low to high molecular weights in fractions 6 to 12 are shown at the left. The distribution (percent) of CRP and GAPDH mRNAs was quantified by RT-qPCR analysis of RNA isolated from 12 gradient fractions.

