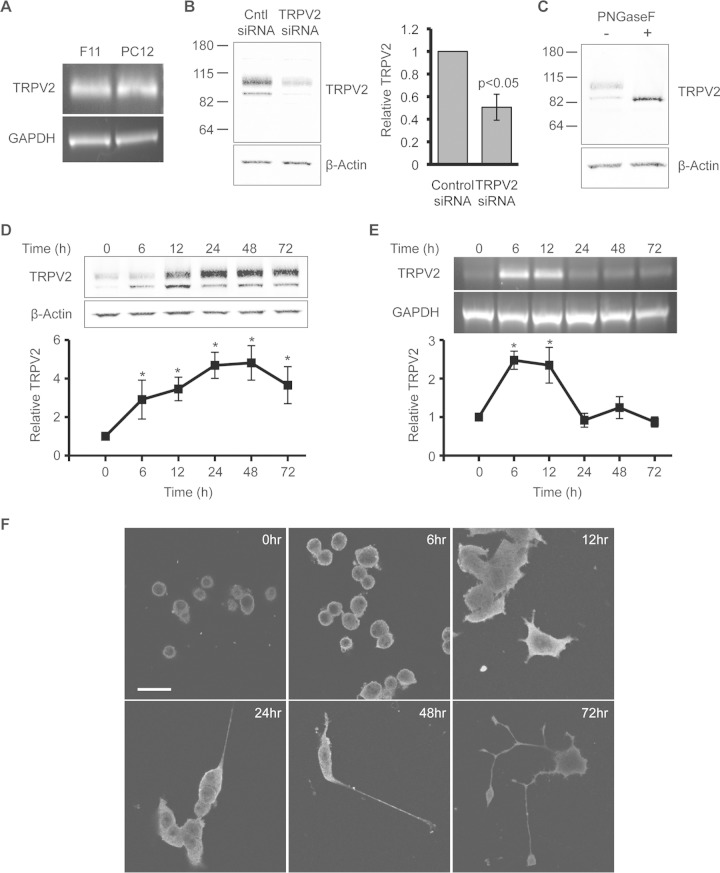
FIG 2.
NGF treatment results in sustained upregulation of TRPV2 expression in PC12 cells. (A) mRNA expression of TRPV2 in F11 cells and PC12 cells was examined by RT-PCR using TRPV2-specific PCR primers. (B) Western blot analysis using TRPV2 monoclonal antibody of PC12 cells transfected with 200 nM control siRNA or TRPV2 siRNA for 48 h. The bar graph represents relative TRPV2 band intensities. The TRPV2 band intensity for control siRNA was defined as 1. Data represent means ± SEM (P < 0.05 by an unpaired t test). (C) PC12 cell protein extracts were treated with and without PNGase F and immunoblotted with TRPV2 and β-actin antibodies. (D) PC12 cells were treated with NGF (100 ng/ml) for the indicated times. Fifty micrograms of whole-cell lysates was then analyzed by Western blotting with TRPV2 and β-actin antibodies. The line graph represents relative TRPV2 protein levels for each time point. The β-actin-normalized TRPV2 band intensity at the 0-h time point was defined as 1. *, P < 0.05 relative to the 0-h NGF time point as determined by one-way ANOVA followed by Dunnett's post hoc test. Data represent means ± SEM for 3 independent experiments. (E) RT-PCR analysis of PC12 cells treated with NGF (100 ng/ml) for the indicated times. RNA was extracted and reverse transcribed to cDNA, followed by PCR amplification using TRPV2- and GAPDH-specific primers. The line graph represents relative TRPV2 mRNA levels for each time point. The GAPDH-normalized TRPV2 band intensity at the 0-h time point was defined as 1. Data represent means ± SEM from 3 independent experiments. *, P < 0.05 relative to the 0-h NGF time point as determined by one-way ANOVA followed by Dunnett's post hoc test. (F) PC12 cells were treated for the indicated times with NGF (100 ng/ml) and then fixed and immunostained with anti-TRPV2 antibody. Bar, 25 μm.

