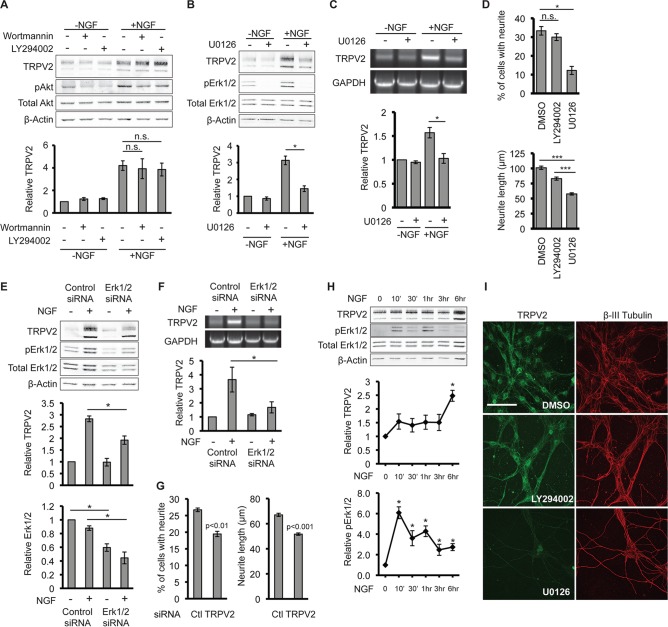
FIG 5.
MAPK signaling mediates upregulation of TRPV2. (A) PC12 cells were pretreated with DMSO, LY294002 (5 μM), or wortmannin (20 nM) for 30 min, followed by treatment with NGF (100 ng/ml for 24 h), as indicated. TRPV2, pAkt, total Akt, and β-actin protein levels were determined by Western blotting. The β-actin-normalized TRPV2 band intensity for DMSO-treated cells in the absence of NGF was defined as 1. Data in the bar graph represent means ± SEM from 3 independent experiments. (B) PC12 cells were pretreated with DMSO or U0126 (10 μM) for 30 min, followed by treatment with NGF (100 ng/ml for 24 h), as indicated. TRPV2, pErk1/2, total Erk1/2, and β-actin protein levels were determined by Western blotting. The β-actin-normalized TRPV2 band intensity for DMSO-treated cells in the absence of NGF was defined as 1. Data in the bar graph represent means ± SEM from 3 independent experiments. (C) PC12 cells were pretreated with DMSO or U0126 (10 μM) for 30 min, followed by treatment with NGF (100 ng/ml for 6 h), as indicated. TRPV2 and GAPDH mRNA levels were determined by RT-PCR. The GAPDH-normalized TRPV2 band intensity for DMSO-treated cells in the absence of NGF was defined as 1. Data in the bar graph represent means ± SEM from 3 independent experiments. (D) Bar graphs representing the percentages of cells with neurites and neurite lengths for PC12 cells cultured in the presence of NGF and either the vehicle (DMSO), LY294002 (5 μM), or U0126 (10 μM). Data represent means ± SEM from 3 independent experiments. (E) PC12 cells were transfected with control or Erk1/2 siRNA for 48 h, followed by 12 h of treatment with NGF, as indicated. TRPV2, pErk1/2, total Erk1/2, and β-actin protein levels were determined by Western blotting. The β-actin-normalized TRPV2 or total Erk1/2 band intensities for control siRNA-transfected cells in the absence of NGF were defined as 1. Data in bar graphs represent means ± SEM from 3 independent experiments. (F) PC12 cells were transfected and treated as described above for panel E, and TRPV2 and GAPDH mRNA levels were determined by RT-PCR. The GAPDH-normalized TRPV2 band intensity for control siRNA-transfected cells in the absence of NGF was defined as 1. Data in the bar graph represent means ± SEM from 4 independent experiments. (G) Bar graphs representing percentages of cells with neurites and neurite lengths for PC12 cells transfected with control or Erk1/2 siRNA and cultured in the presence of NGF for 72 h. Data represent means ± SEM from 5 independent experiments. (H) PC12 cells were treated with NGF (100 ng/ml) for the indicated times, followed by Western blot analysis with TRPV2, pErk1/2, total Erk1/2, and β-actin antibodies. Data in line graphs represent relative β-actin-normalized TRPV2 and total Erk1/2-normalized pErk1/2 levels. Band intensities at the 0-h NGF time point were defined as 1. Data represent means ± SEM from 3 independent experiments. *, P < 0.05 relative to the 0-h NGF time point as determined by one-way ANOVA followed by Dunnett's post hoc test. (I) E18 DRG neurons were cultured in the presence of DMSO, LY294002 (25 μM), or U1026 (10 μM) for 5 days and then immunostained for TRPV2 (green) and βIII-tubulin (red). All images were obtained with identical microscope settings. Bar, 100 μm.

