FIG 9.
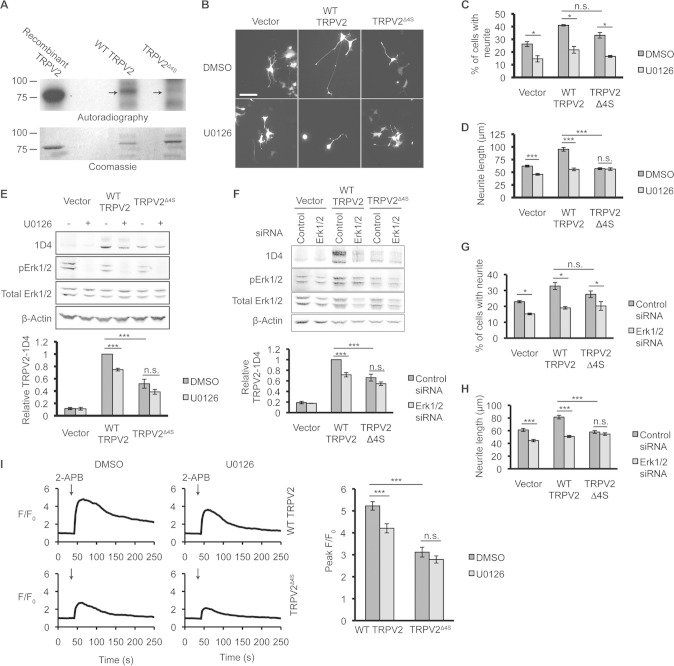
Phosphorylation of TRPV2 by ERK enhances NGF-induced neurite outgrowth in PC12 cells. (A) One microgram of recombinant TRPV2, WT TRPV2, or TRPV2Δ4S isolated from HEK293T cells was incubated with activated Erk2 and [γ-32P]ATP. Phosphorylation of the TRPV2 proteins was determined by autoradiography, and the presence of protein was confirmed by Coomassie staining. (B) Representative images of PC12 cells transfected with GFP plus either the empty vector or 1D4-tagged WT TRPV2 or TRPV2Δ4S and treated with NGF (100 ng/ml) in either the absence or presence of U0126 (10 μM) for 72 h. (C) Percentage of cells with neurites, for PC12 cells imaged in panel B. Data represent means ± SEM from 3 independent experiments. (D) Mean neurite lengths ± SEM for cells imaged in panel B (vector control plus DMSO, n = 265; vector control plus U0126, n = 126; WT TRPV2 plus DMSO, n = 181; WT TRPV2 plus U0126, n = 93; TRPV2Δ4S plus DMSO, n = 195; TRPV2Δ4S plus U0126, n = 119). (E) Western blot analysis of PC12 cells transfected and treated as described above for panels B to D with the indicated antibodies. Data in the bar graph represent mean band intensities ± SEM from 3 independent experiments. The β-actin-normalized TRPV2-1D4 band intensity for WT-TRPV2-expressing, DMSO-treated cells was defined as 1. (F) Western blot analysis with the indicated antibodies for PC12 cells transfected with control or Erk1/2 siRNA for 24 h, followed by 24 h of transfection with GFP plus the vector or 1D4-tagged WT TRPV2 or TRPV2Δ4S and 72 h of treatment with NGF. Data in the bar graph represent mean band intensities ± SEM from 3 independent experiments. The β-actin-normalized TRPV2-1D4 band intensity for cells transfected with control siRNA and WT TRPV2 was defined as 1. (G) Bar graph representing the percentage of PC12 cells with neurites, transfected and treated as described above for panel F. Data represent means ± SEM from 3 independent experiments. (H) Mean neurite length ± SEM for cells transfected and treated as described above for panel F (vector plus control siRNA, n = 145; vector plus Erk1/2 siRNA, n = 151; WT TRPV2 plus control siRNA, n = 162; WT TRPV2 plus Erk1/2 siRNA, n = 123; TRPV2Δ4S plus control siRNA, n = 138; TRPV2Δ4S plus Erk1/2 siRNA, n = 103). (I) Intracellular Ca2+ transients measured by Fluo4 fluorescence using time-lapse microscopy. F11 cells expressing WT TRPV2 or TRPV2Δ4S were treated with 2-APB (100 μM) at the 45-s time point (indicated by arrows). Data represent mean normalized Fluo4 intensities. Data in the bar graph represent peaks in normalized Fluo4 fluorescence intensity determined under each condition (WT TRPV2 plus DMSO, n = 177; WT TRPV2 plus U0126, n = 129; TRPV2Δ4S plus DMSO, n = 77; TRPV2Δ4S plus U0126, n = 125). Data represent the means ± SEM.

