FIG 2.
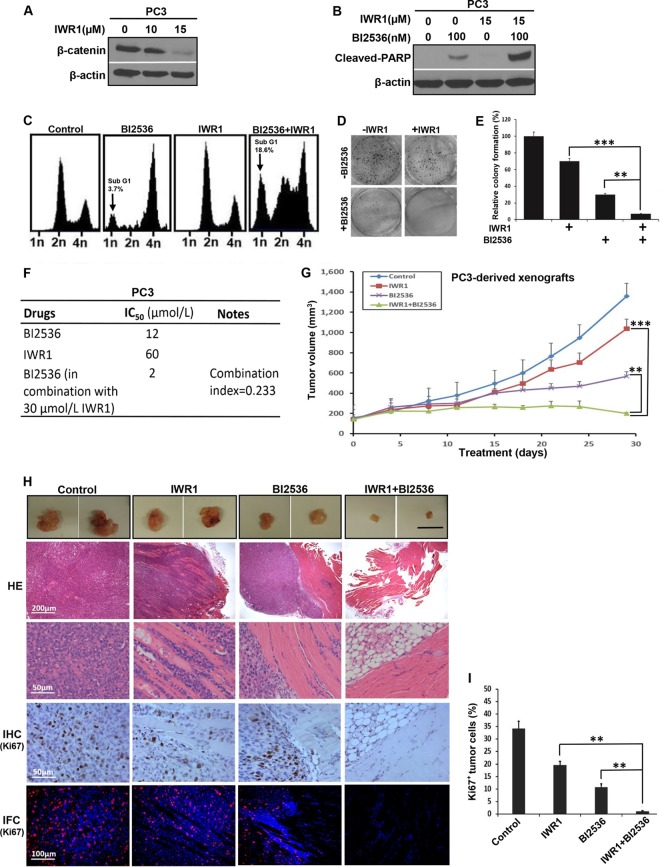
BI2536 and IWR1 synergistically inhibit growth of PC3 cell-derived xenograft tumors. (A) PC3 cells were treated with increasing concentrations of IWR1 for 24 h and harvested. (B) PC3 cells were treated with BI2536, IWR1, or both for 24 h, followed by IB. (C) PC3 cells were treated with BI2536, IWR1, or both for 4 days. Harvested cells were subjected to FACS analysis. (D) PC3 cells (0.5 × 10³) were plated into 6-well plates for 24 h and then treated with BI2536, IWR1, or both drugs. After changing to fresh medium containing the drug(s) every 3 days for 2 weeks, cells were paraformaldehyde fixed, and colony formation was monitored by crystal violet staining. Data shown are representative of data from 3 repeats. (E) Quantification of colonies in panel D. The numbers of colonies were quantified by using ImageJ software (means ± standard deviations; n = 3 independent experiments). **, P < 0.01; ***, P < 0.001. (F) Combination indexes of BI2536 and IWR1 in PC3 cells. (G) Tumor growth curves of PC3-derived mouse xenografts. Nude mice were inoculated with PC3 cells (1 × 10⁶) for 2 weeks and intravenously injected with BI2536 (12 mg/kg of body weight), IWR1 (50 mg/kg), or a combination of both drugs by oral gavage. The sizes of the tumors in each group were measured every 3 days (means ± standard errors of the means; n = 4 mice from each experimental group). **, P < 0.01 compared with the BI2536-treated group on day 29; ***, P < 0.001 compared with the IWR1-treated group on day 29. (H) Representative images of H&E and IHC or IFC staining for Ki67 on formaldehyde-fixed, paraffin-embedded, PC3-derived tumor sections. (I) Microscopic quantification of Ki67 signals as percentages of Ki67-positive cells compared to total numbers of cells. Multiple tumor sections were calculated (means ± standard errors of the means; n = 4). **, P < 0.01. Western blots in panels A and B are representative of results from three or more experiments.

